
Figures & data
Figure 1 Gating strategies for monocytes and subgroups.
Notes: (a) Nonclassical monocytes; (b) intermediate monocytes; (c) classical monocytes.
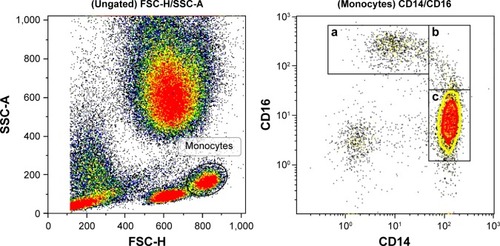
Table 1 Population characteristics
Table 2 Total monocytes and subpopulation distribution of monocytes, expressed as percentage (interquartile range)
Table 3 Recruitment molecules on subpopulation of monocytes, expressed as median percentage positive for marker (interquartile range)
Table 4 B-lymphocytes and subgroups, expressed as median percentage (interquartile range)