
Figures & data
Figure 1 Spectrum of neovascular age-related macular degeneration without drusen in the fellow eye.
Abbreviations: FA, fluorescein angiography; OCT, optical coherence topography; PED, pigment epithelial detachment.
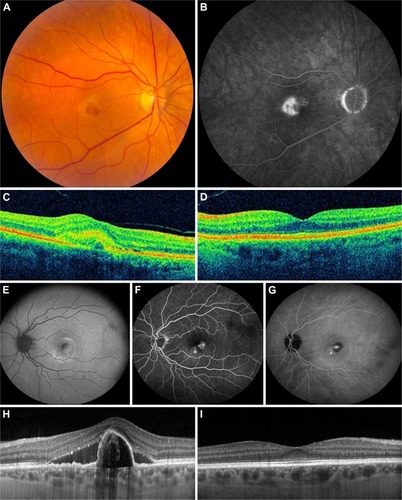
Table 1 Baseline characteristics of patients with neovascular age-related macular degeneration without drusen in the fellow eye
Table 2 Treatment and number of received intravitreal injections during follow-up
Figure 2 Mean change in BCVA during follow-up, compared to baseline.
Abbreviations: BCVA, best-corrected visual acuity; ETDRS, Early Treatment Diabetic Retinopathy Study; SE, standard error.
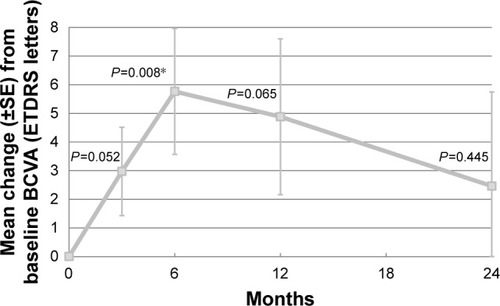
Table 3 Treatment and best-corrected visual acuity of patients with polypoidal choroidal vasculopathy during follow-up
Figure 3 Mean change in CRT during follow-up, compared to baseline.
Abbreviations: CRT, central retinal thickness; SE, standard error.
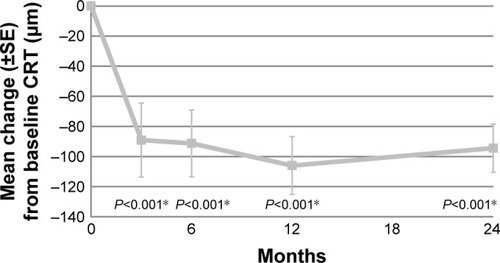
Figure 4 Mean CRT during follow-up per type of neovascularization (type 1 versus type 2).
Abbreviations: CRT, central retinal thickness; SE, standard error.
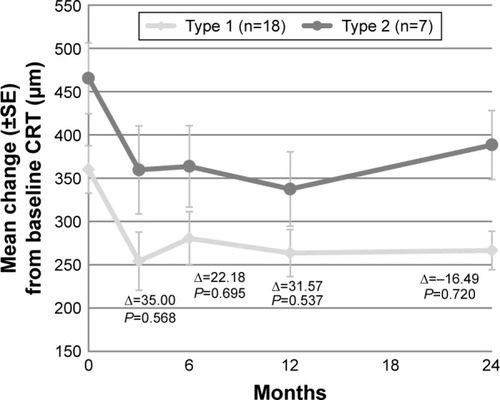
Table 4 Received treatments in several patients in whom subretinal fluid resolved for ≥3 months after treatment