
Figures & data
Figure 1 Grading standard used for a CRVO with none to mild ischemia (grade 1).
Abbreviations: CRVO, central retinal vein occlusion; SD-OCT, spectral domain optical coherence tomography.
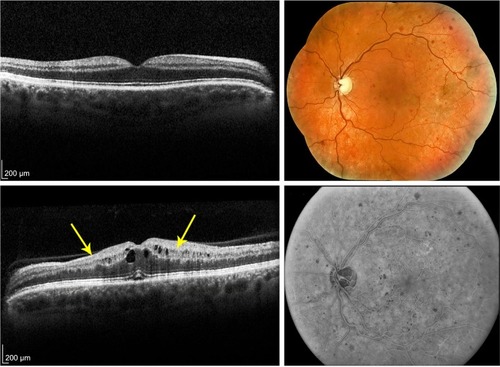
Figure 2 Grading standard used for a CRVO with moderate ischemia (grade 2).
Abbreviations: CRVO, central retinal vein occlusion; SD-OCT, spectral domain optical coherence tomography; N, nasal; S, superior; T, temporal; I, inferior.
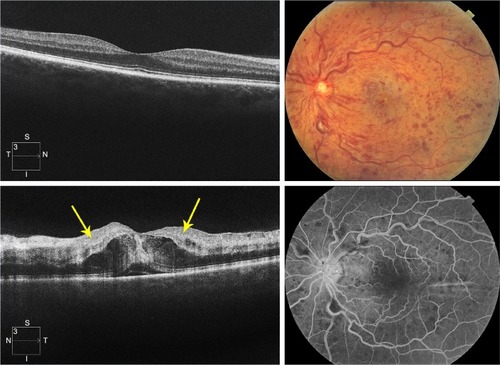
Figure 3 Grading standard used for a CRVO with severe ischemia (grade 3).
Abbreviations: CRVO, central retinal vein occlusion; SD-OCT, spectral domain optical coherence tomography; N, nasal; S, superior; T, temporal; I, inferior.
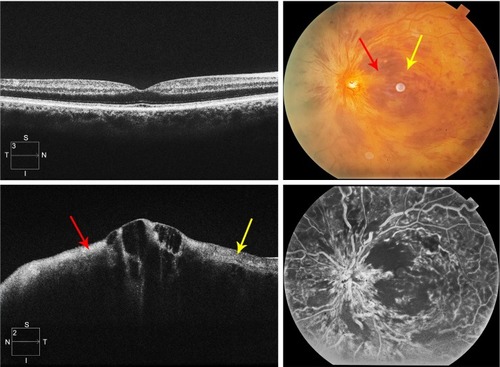
Figure 4 Bland–Altman plots of intragrader repeatability and intergrader reproducibility in the assessment of SD-OCT images in acute central retinal vein occlusion.
Abbreviations: SD, standard deviation; SD-OCT, spectral domain optical coherence tomography.

Table 1 Characteristics of patients and eyes
Table 2 Distribution of baseline characteristics and outcomes by baseline grade of ischemia
Figure 5 The time course of logMAR visual acuity graphed as a function of time in months and stratified by baseline ischemia grade as graded from SD-OCT images.
Abbreviations: logMAR, logarithm of the minimum angle of resolution; SD-OCT, spectral domain optical coherence tomography.
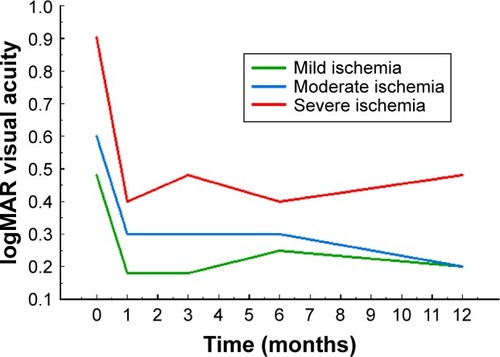
Figure 6 Graphs of the relationships of three SD-OCT signs to each other.
Abbreviations: PAMM, paracentral acute middle maculopathy; p-MLM, prominent middle-limiting membrane; SD-OCT, spectral domain optical coherence tomography.
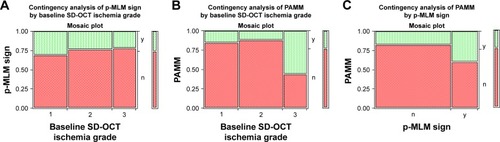
Figure 7 Evolution of SD-OCT signs of ischemia over time.
Abbreviations: INL, inner nuclear layer; PAMM, paracentral acute middle maculopathy; p-MLM, prominent middle-limiting membrane; SD-OCT, spectral domain optical coherence tomography.
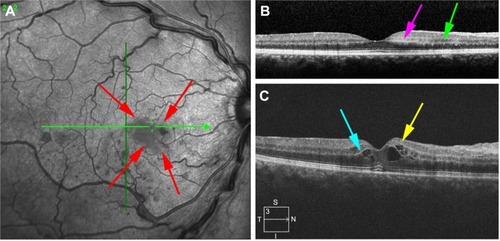
Table 3 Number of interventions over 12 months in acute central retinal vein occlusion