
Figures & data
Figure 1 Distribution of patients into different groups: patients were divided into six groups according to the grade of nuclear sclerosis and the type of ultrasound energy used.
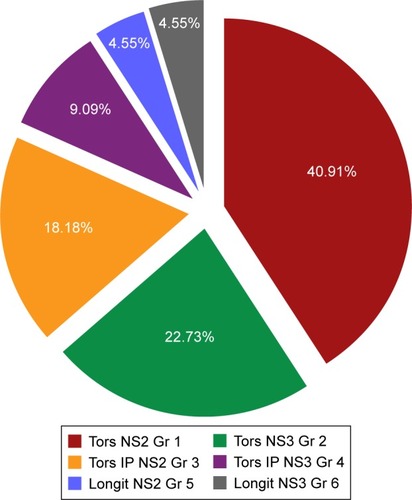
Figure 2 Mean shaft temperatures in different groups: The shaft temperatures near the wound were highest when torsional energy was used in grade 3 cataract.
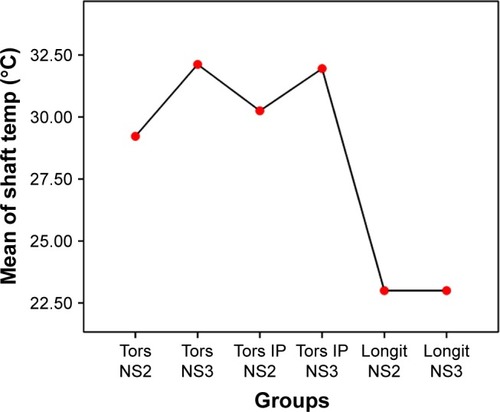
Figure 3 Mean tip temperatures in different groups: The corneal surface temperatures at the distal end of the tip are recorded for each group.
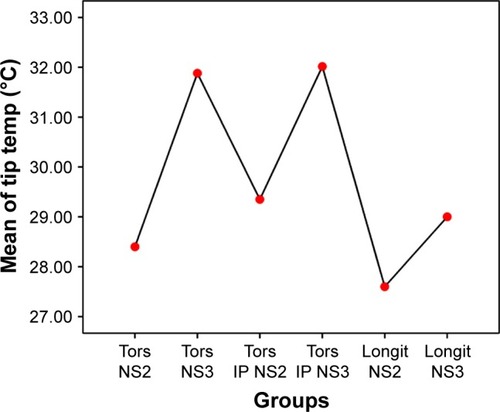
Table 1 Shaft and corneal surface temperatures of different groups
Table 2 Comparison of differences in shaft temperatures (°C) of different modes
Figure 4 (A) Correlation between shaft temperatures and average amplitude of ultrasound. (B) Correlation of shaft temperatures with aspiration flow rate.
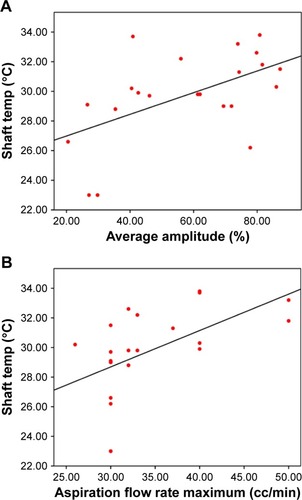
Figure 5 (A) Torsional amplitude of 60–100. (B) The shaft of the probe becomes extremely hot.
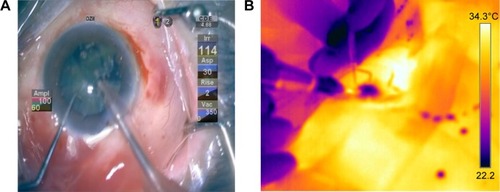
Figure 6 (A) Longitudinal ultrasound in use. (B) Only the surface over the tip shows elevation of temperature, while the wound site remains cool.
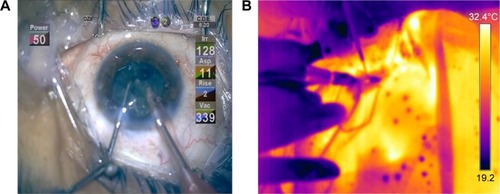
Figure 7 (A) Picture shows combined torsional and longitudinal modalities in use during surgery. (B) Thermal image shows initial elevation of temperatures at the corneal surface over the tip early on in surgery. (C) During the later phase, the whole shaft glows, producing heat signatures at the wound and corneal surface.
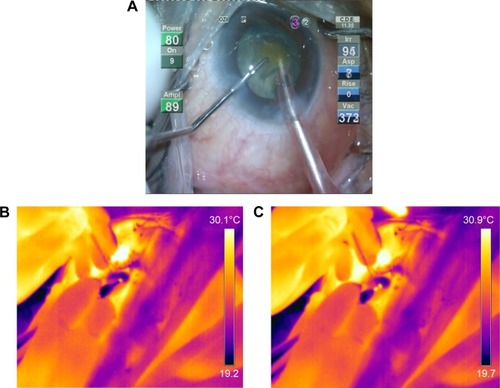
Table 3 Pearson correlation and significance of shaft temperatures with average amplitude and aspiration flow rate