Figures & data
Table 1 Baseline characteristics of the patients
Table 2 Combined procedures with PPV
Table 3 Intra- and postoperative complications
Table 4 Characteristics of the eyes that required additional treatments
Figure 1 Changes in pre- and postoperative logMAR.
Abbreviation: logMAR, logarithm of the minimal angle of resolution.
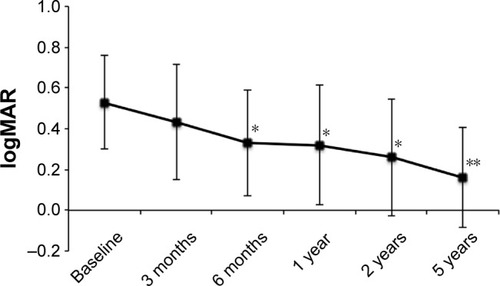
Figure 2 Changes in pre- and postoperative foveal thicknesses.
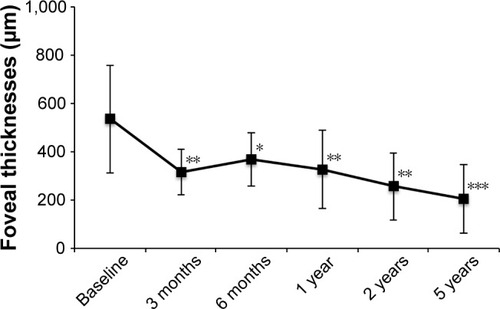
Figure 3 Five-year results of visual acuity (A, C, E) and foveal thickness (B, D, F) with or without simultaneously performed procedures such as intravitreal injection of TA (A, B), arteriovenous sheathotomy (C, D), or internal limiting membrane peeling (E, F).
Abbreviations: TA, triamcinolone acetonide; logMAR, logarithm of the minimal angle of resolution.
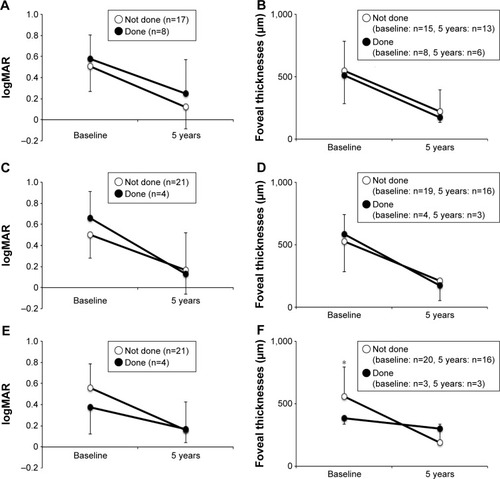
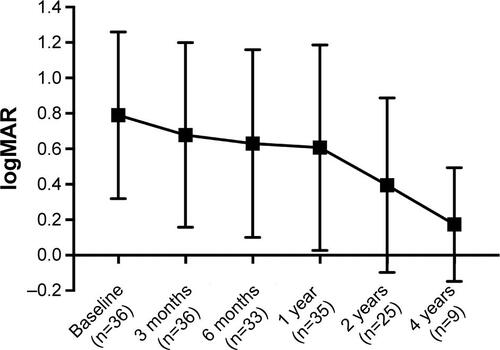
Figure S1 Changes in pre- and postoperative logMAR of the patients who withdrew before the 5-year follow-up visit.
Abbreviation: logMAR, logarithm of the minimal angle of resolution.