
Figures & data
Table 1 Baseline patient characteristics
Figure 1 Confocal images of conjunctival epithelium stained with LC3.
Notes: Blue represents DAPI-stained nuclei and red represents the antibody for LC3. Overlap of blue and red indicates normal conjunctiva with nuclear translocation of LC3. (A) Impression cytology sample with minimal nuclear translocation of LC3. This indicates a high degree of autophagy. (B) Impression cytology sample with significant nuclear translocation of LC3. This indicates a normal conjunctival epithelium. Magnification ×60.
Abbreviation: LC3, microtubule-associated protein light chain 3.
Abbreviation: LC3, microtubule-associated protein light chain 3.
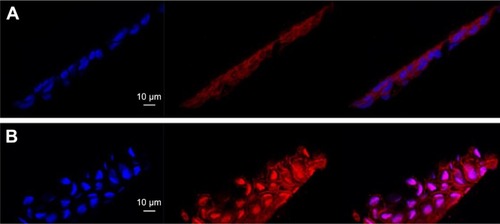
Table 2 Patient characteristics stratified based on LC3 status
Figure 2 Significantly higher Schirmer scores were obtained in samples with LC3 ratios ≥1.0 (P<0.05).
Notes: The asterisk denotes a significant difference in the two Schirmer scores. Analysis was done using one-way ANOVA followed by Tukey’s multiple comparisons test. The sample size for eyes with LC3 ratio ≥1.0 is 38; the sample size for eyes with LC3 ratio <1.0 is 18.
Abbreviations: ANOVA, analysis of variance; LC3, microtubule-associated protein light chain 3.
Abbreviations: ANOVA, analysis of variance; LC3, microtubule-associated protein light chain 3.
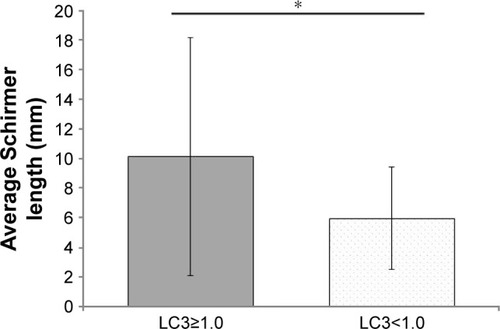
Table 3 Pearson’s correlation coefficients