
Figures & data
Figure 1 Cumulative bar graph for distance visual acuity at 12 months.
Abbreviations: CDVA, corrected distance visual acuity; UDVA, uncorrected distance visual acuity.
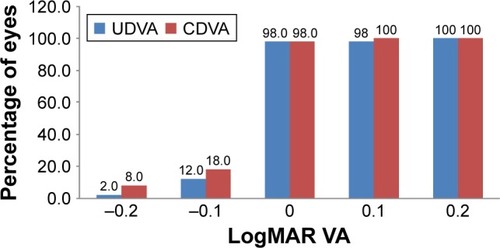
Figure 2 Cumulative bar graph for binocular near visual acuity at 12 months.
Abbreviations: DCNV, distance corrected near vision; UCNV, uncorrected near vision.
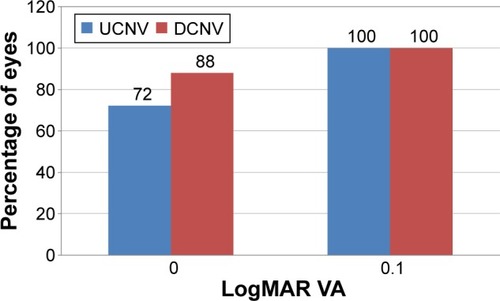
Table 1 Distant and near visual acuity at 1, 6, and 12 months postoperatively
Figure 3 Stability of refraction over time.
Abbreviation: SE, spherical equivalent.
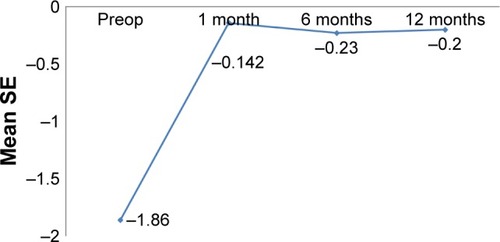
Table 2 Reading acuity and reading speed over time
Figure 4 Binocular defocus curves under mesopic conditions.
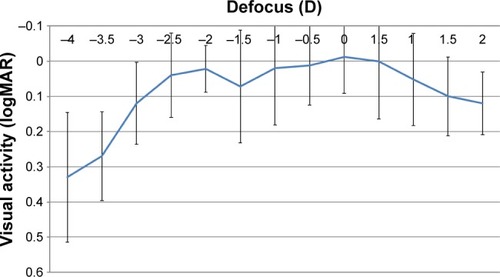
Figure 5 Contrast sensitivity over time.
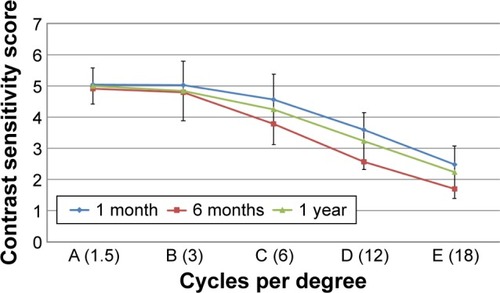
Table 3 Patient satisfaction – dysphotopsia score and spectacle independence at 1, 3, and 12 months postoperatively