
Figures & data
Table 1 Demographics of control and diabetic patients (eyes)
Table 2 Classification of groups of diabetic eyes
Figure 1 Corneal endothelium picture taken by EM-3000 Specular Microscope (CBD/Tomey, Phoenix, AZ, USA) for non-DM female (46 years old).
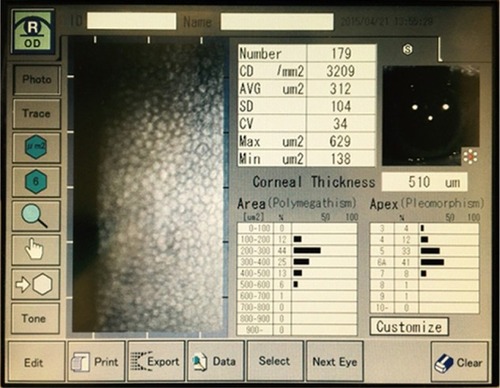
Figure 2 Corneal endothelium picture taken by EM-3000 Specular Microscope (CBD/Tomey, Phoenix, AZ, USA) for DM female (46 years old) with PDR (DM duration of 20 years and HbA1c =9.2%).
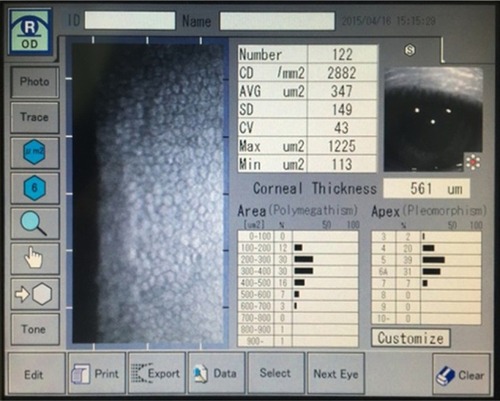
Figure 3 Corneal endothelium picture taken by EM-3000 Specular Microscope (CBD/Tomey, Phoenix, AZ, USA) for non-DM male (58 years old).
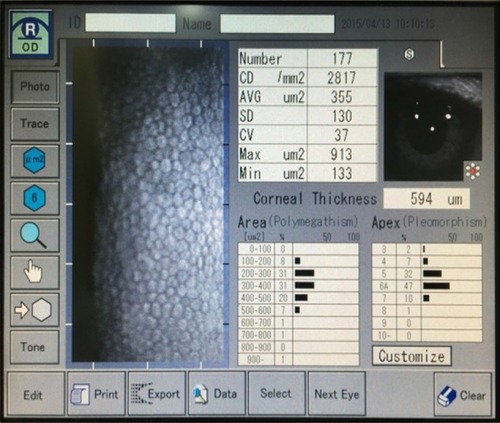
Figure 4 Corneal endothelium picture taken by EM-3000 Specular Microscope (CBD/Tomey, Phoenix, AZ, USA) for DM male (56 years old) without DR (DM duration of 8 years and HbA1c =9.5%).
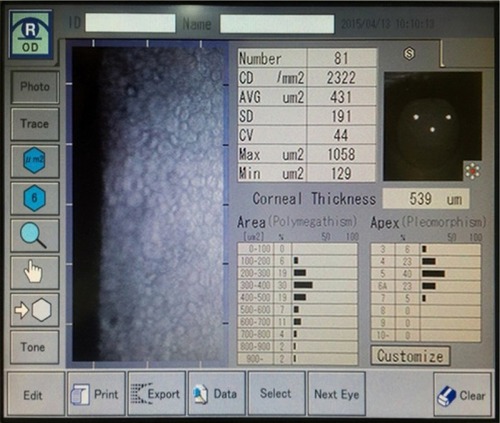
Table 3 A comparison of the mean values of CCT, ECD, CV, and hexagonality between control and diabetic eyes (mean ± SD)
Table 4 A comparison of the mean values of CCT, ECD, CV, and hexagonality between the diabetic groups, according to duration of DM (mean ± SD)
Table 5 A comparison of the mean values of CCT, ECD, CV, and hexagonality between the diabetic groups, according to HbA1c% (mean ± SD)
Table 6 A comparison of the mean values of CCT, ECD, CV, and hexagonality between the diabetic groups, according to the status of DR (mean ± SD)
Table 7 Correlation between corneal changes and DM duration, HbA1c%, and DR status