
Figures & data
Figure 1 Shows different genotypes of SMOC2 polymorphism.
Notes: Lane M: 100 bp DNA marker, Lane 1 and 3: homozygous (GG) wild type (97 bp, 165 bp, and 233 bp), Lane 2: heterozygous (GA) genotype (388 bp, 233 bp, 165 bp, and 97 bp), Lane 4: mutant (AA) genotype (97 bp and 388 bp).
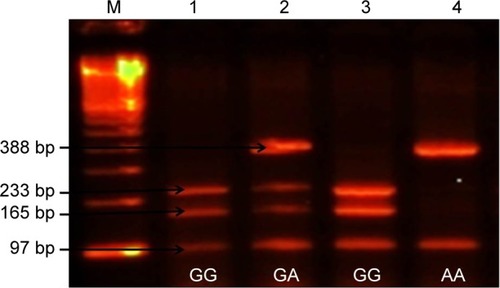
Table 1 Allele and genotypic distribution of the SMOC2 (G>A) polymorphism in PG patients and controls
Table 5 Comparison of allele and genotype distribution of the SMOC2 (G>A) polymorphism between PACG patients and controls
Table 2 Allele and genotype distribution of the SMOC2 (G>A) polymorphism in male and female primary glaucoma patients
Figure 2 Shows the frequencies of various genotypes and alleles in the controls and POAG and PACG patients.
Abbreviations: POAG, primary open angle glaucoma; PACG, primary angle closure glaucoma.
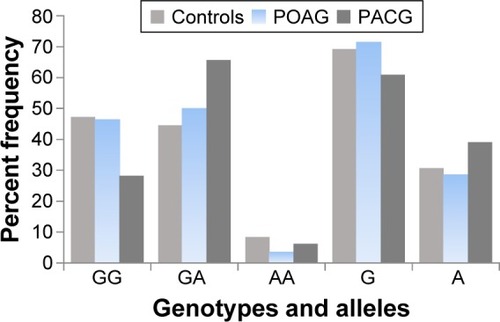
Table 3 Allele and genotype distribution of the SMOC2 (G>A) polymorphism in POAG and PACG patients
Table 4 Comparison of allele and genotype distribution of the SMOC2 (G>A) polymorphism between POAG patients and controls