
Figures & data
Figure 1 Study design of (A) pharmacokinetic study and (B) safety study.
Abbreviations: IP, investigational product; PK, pharmacokinetics; TC, telephonic contact.
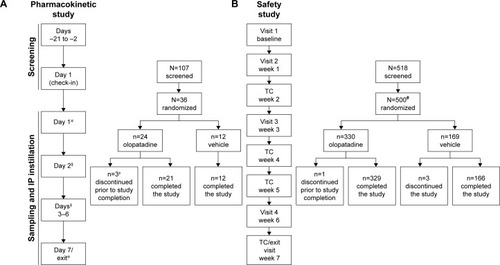
Table 1 Baseline characteristics and subject demographics
Figure 2 Mean olopatadine 0.77% plasma concentration over time (A) and AUC0–12 (B) following single-dose (Day 1) and multiple-dose (Day 7) exposure.
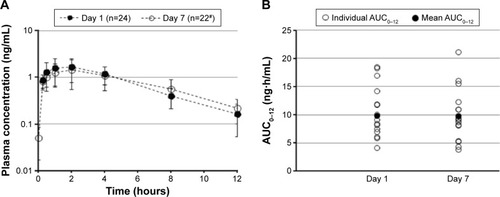
Table 2 Pharmacokinetic parameters following single- and multiple-dose exposures of olopatadine 0.77% (pharmacokinetics population)
Table 3 Summary of TEAEs regardless of study drug relationship by treatment (safety population)
Table 4 Summary of TEAEs in the selected age subgroups occurring at an incidence of ≥1% by treatment
Table 5 Summary of safety parameters in the overall safety population and selected age subgroups at Week 6 or at the Early Exit visit by treatment
Table S1 Pharmacokinetic parameters following single- and multiple-dose exposures of olopatadine 0.77% in Japanese and non-Japanese subjects
Table S2 Overall summary of treatment-related AEs occurring at an incidence of ≥1% by treatment (safety population)
Table S3 Summary of TEAEs in selected age subgroups occurring at an incidence of ≥1% by treatment (safety population)
Table S4 Comparison of mean human plasma pharmacokinetic parameters following topical ocular and oral single- and multiple-dose exposures of olopatadine