Figures & data
Table 1 Demographic and clinical characteristics of the patients
Figure 1 Intravitreal injection intervals before and after the switch from ranibizumab to aflibercept.
Notes: Boxes show the median and the 1st and 3rd quartiles. Whiskers extend to the most extreme data point, which is no more than 1.5 times the interquartile range from the box. P-value, Mann–Whitney U-test. n=15.
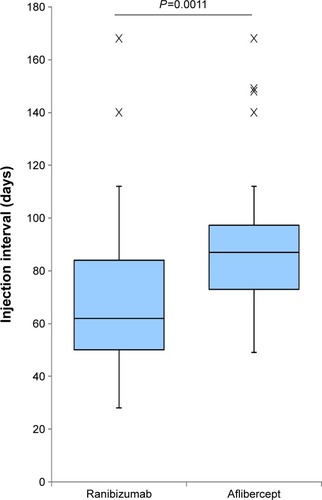
Figure 2 Intravitreal injection intervals just before and after the switch from ranibizumab to aflibercept.
Notes: The “interval just before the switch” refers to the interval from the last injection of ranibizumab to the first injection of aflibercept. “Just after the switch” is the interval between the first and the second injections of aflibercept. Boxes show the median and the 1st and 3rd quartiles. Whiskers extend to the most extreme data point, which is no more than 1.5 times the interquartile range from the box. P-value, Wilcoxon signed-rank test. n=15.
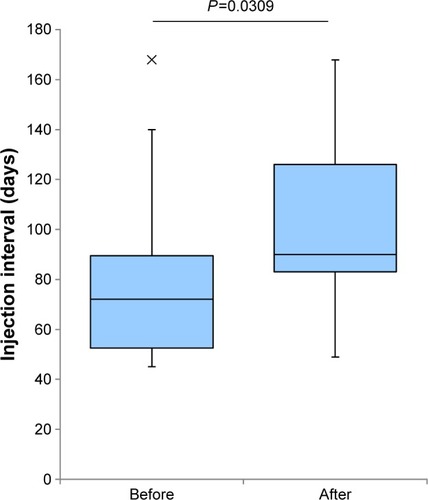
Figure 3 CRT during the study period.
Notes: Boxes show the median and the 1st and 3rd quartiles. Whiskers extend to the most extreme data point, which is no more than 1.5 times the interquartile range from the box. P-value, Mann–Whitney U-test. n=15.
Abbreviation: CRT, central retinal thickness.
Abbreviation: CRT, central retinal thickness.
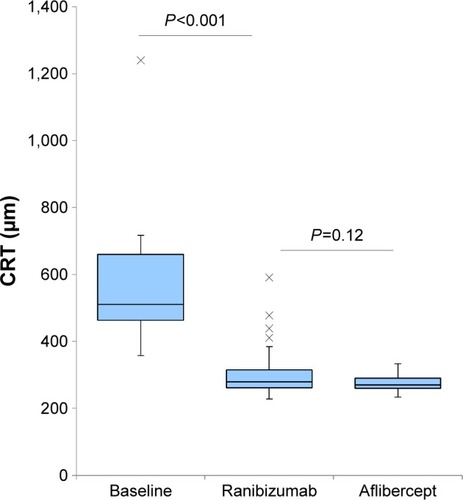
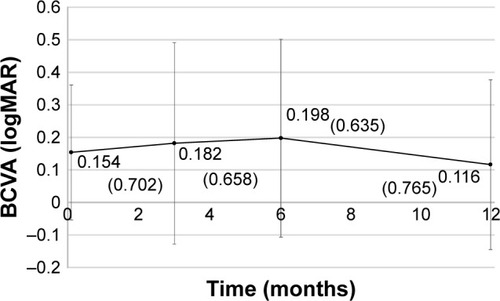
Figure 4 BCVA after the switch to aflibercept.
Notes: The plots show the mean values ± standard deviation. The numbers shown in parentheses are decimal visual acuity (converted from mean logMAR). n=15 (0, 3, and 6 months), n=7 (12 months).
Abbreviations: BCVA, best-corrected visual acuity; logMAR, logarithm of minimal angle of resolution.
Abbreviations: BCVA, best-corrected visual acuity; logMAR, logarithm of minimal angle of resolution.