
Figures & data
Figure 1 The variability in the scores of the type of visual field between assessor A and B for upper and lower hemifield.
Notes: The x-axis represents the scores that are given for upper and lower hemifield; 1) overall sensitivity loss, 2) nasal step, 3) para-central scotoma, 4) arcuate scotoma, 5) altitudinal defect, 6) central island of vision, 7) temporal crescent, 8) hemianopia, and 9) no visual field defect present. The y-axis represents the amount of times each score has been given. The colors blue and green represent assessors A and B, respectively.
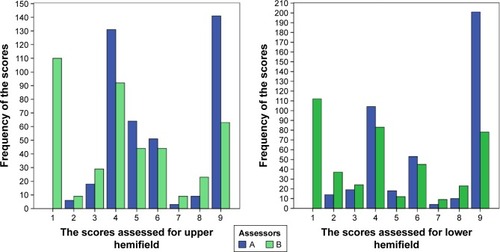
Table 1 Frequency of blindness according to the WHO criterion (N=423 visual fields)
Table 2 Frequency of blindness according to the 5-point ordinal scale, dichotomized (N=423 visual fields)
Table 3 Frequency of blindness according to the WHO criterion and 5-point ordinal scale, when visual field type was rated similarly (N=224 visual fields)
Table 4 Assessment of type of visual field (defect) with the 5-point ordinal scale