Figures & data
Figure 1 (A) Frequency distribution of age (in years); (B) frequency distribution of spherical equivalent (in diopters, D); (C) frequency distribution of preoperative corneal thickness (pachymetry, in micrometers) in all cases.
Note: Red line represents the normal distribution curve.
Abbreviation: SD, standard deviation.
Abbreviation: SD, standard deviation.
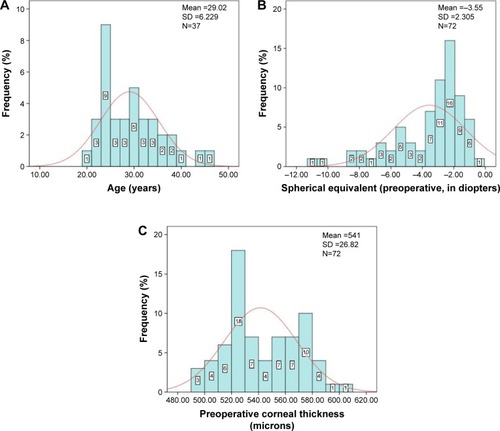
Figure 2 Scatter plot of age (in years) versus preoperative corneal pachymetry thickness (in micrometers).
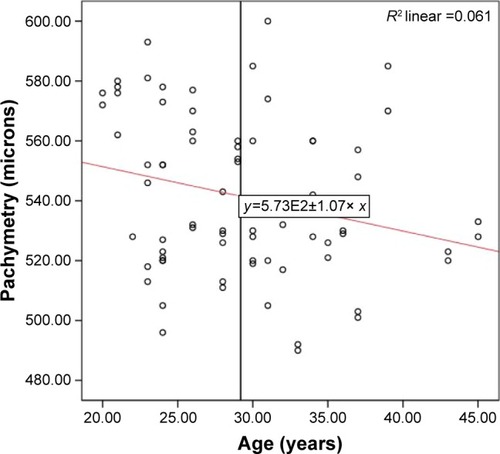
Figure 3 Frequency distribution of flap thickness (in micrometers) for 72 eyes operated on using the Moria M2 single-use head 90 microkeratome.
Note: Intended thickness was 120 µm.
Abbreviation: SD, standard deviation.
Abbreviation: SD, standard deviation.
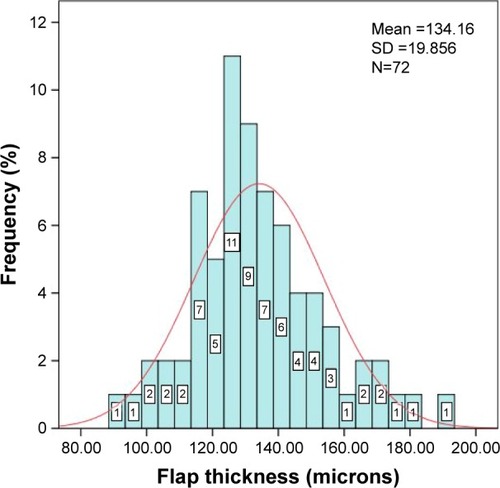
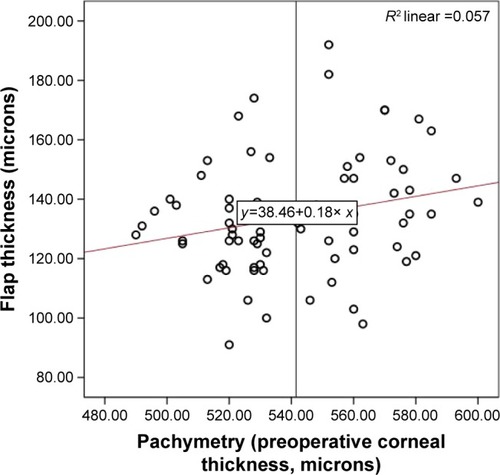
Figure 4 Scatter plot of preoperative corneal pachymetry values versus flap thickness (in micrometers).
Note: A statistically significant correlation is seen for thicker corneas producing thicker flaps (r=0.239; P=0.043).