Figures & data
Figure 1 Multicolor imaging, FAF, IR and SD-OCT of a patient affected by RPD.
Notes: (A) Multicolor imaging showing a yellowish–green reticular pattern and some RPD with a target appearance characterized by a more intense yellowish/greenish core surrounded by a decreased intensity. (B) Blue FAF showing RPD as hypoautofluorescent dots surrounded by a faint hyperautofluorescent halo. Several RPD have a isoautofluorescent core, conferring a target aspect. (C) IR showing RPD as small lesions clustered in a reticular pattern and a variable target aspect, with an isoreflective core surrounded by hyporeflective halo. (D) Combined IR and structural SD-OCT B-scan passing through the fovea showing RPD as discrete accumulation of hyperreflective material above the RPE in the subretinal space. Green arrow shows the position of the scan lines used to generate the cross-sectional SD-OCT images. Magnifications showing an example of four different stages of RPD: 1) diffuse accumulation of granular hyperreflective material between RPE and EZ (hash); 2) mounds of material bowing and distorting EZ profile (star); 3) conical accumulations with focal interruption of EZ (asterisk); 4) drusenoid material reabsorption and migration in inner retinal layers (triangle).
Abbreviations: FAF, fundus autofluorescence; IR, infrared reflectivity; SD-OCT, spectral-domain optical coherence tomography; RPD, reticular pseudodrusen; RPE, retinal pigment epithelium; EZ, ellipsoid zone.
Abbreviations: FAF, fundus autofluorescence; IR, infrared reflectivity; SD-OCT, spectral-domain optical coherence tomography; RPD, reticular pseudodrusen; RPE, retinal pigment epithelium; EZ, ellipsoid zone.
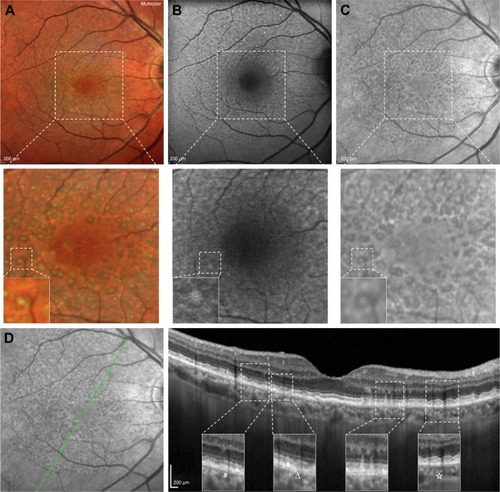
Figure 2 OCT-A of a patient affected by RPD.
Notes: (A, B) Superficial and deep capillary plexuses (A and B, respectively), corresponding en-face OCT and B-scan with flow showing no significant alterations. (C, D) Choriocapillaris and choroidal segmentation (C and D, respectively) showing choriocapillaris and choroidal impairment of the vessel density (dashed triangles and circles, respectively). Measurement: 3×3 mm OCT-A.
Abbreviations: OCT-A, optical coherence tomography angiography; RPD, reticular pseudodrusen; OCT, optical coherence tomography.
Abbreviations: OCT-A, optical coherence tomography angiography; RPD, reticular pseudodrusen; OCT, optical coherence tomography.
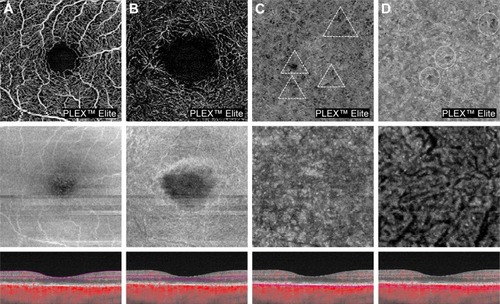
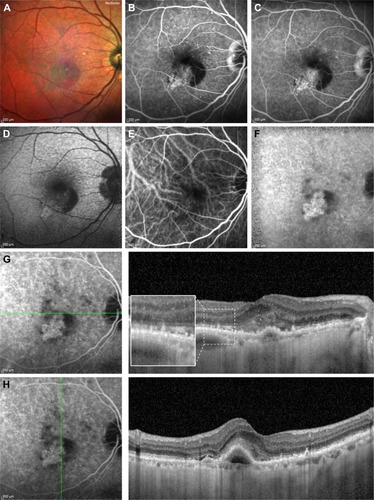
Figure 3 Multicolor imaging, FA, fundus autofluorescence, ICGA and structural SD-OCT of a patient affected by RPD and a type 1 CNV.
Notes: (A, D) Multicolor imaging (A) and fundus autofluorescence (D) showing RPD, a large hemorrhage around the central lesion. FA (B, C) and ICGA (E, F) revealing the presence of a type 1 CNV with a typical hyperfluorescent plaque in the late phase of ICGA (F). (G, H) Combined ICGA and structural horizontal and vertical SD-OCT B-scans passing through the fovea revealing the presence of RPD and an active type 1 CNV. Green arrows show the position of the scan lines used to generate the cross-sectional SD-OCT images.
Abbreviations: FA, fluorescein angiography; ICGA, indocyanine green angiography; SD-OCT, spectral-domain optical coherence tomography; RPD, reticular pseudodrusen; CNV, choroidal neovascularization.
Abbreviations: FA, fluorescein angiography; ICGA, indocyanine green angiography; SD-OCT, spectral-domain optical coherence tomography; RPD, reticular pseudodrusen; CNV, choroidal neovascularization.