Figures & data
Table 1 NEI VFQ-25 score at baseline and at follow-up in cohort 1 and cohort 2
Figure 1 VA outcome was divided into three subgroups: gain of ≥15 letters (cohort 1: n=5, cohort 2: n=3), gain or loss (stabilization) of <15 letters (cohort 1: n=29, cohort 2: n=14), and loss of ≥15 letters (cohort 1: n=16, cohort 2: n=9). This figure shows the (A) mean change in overall NEI VFQ-25 composite score, and mean change in NEI VFQ-25 score of (B) near activities subscale, (C) distance activities subscale, and (D) vision-specific dependency subscale. Error bars represent the standard error of the mean.
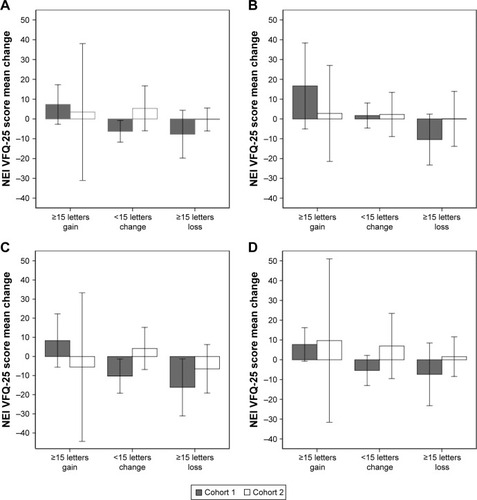
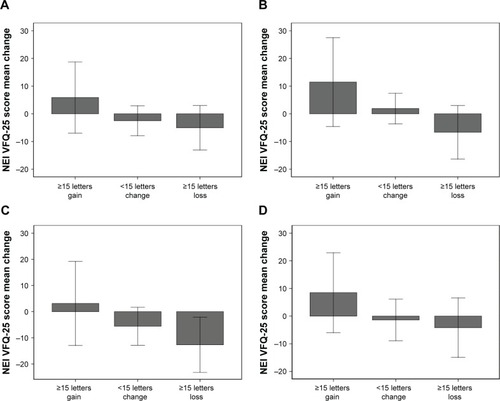
Figure 2 VA outcome was divided into three subgroups in the merged cohorts: gain of ≥15 letters (n=8), gain or loss (stabilization) of <15 letters (n=43), and loss of ≥15 letters (n=25). This figure shows the (A) mean change in overall NEI VFQ-25 composite score, and mean change in NEI VFQ-25 score of (B) near activities subscale, (C) distance activities subscale, and (D) vision-specific dependency subscale. Error bars represent the standard error of the mean.