Figures & data
Figure 1 Study flow diagram.
Notes: Withdrawn case in site 2 received one IPL treatment but was withdrawn because it was discovered, after the treatment, that the patient has a history of migraines.
Abbreviations: FU, follow-up; LFU, lost to follow-up; Tx, treatment session.
Abbreviations: FU, follow-up; LFU, lost to follow-up; Tx, treatment session.
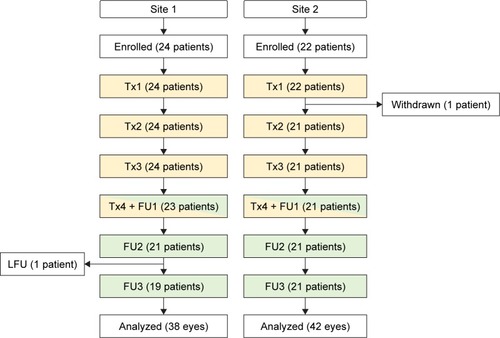
Table 1 Demographic information
Figure 2 Longitudinal analysis of tear breakup time.
Notes: Error bars: standard error of the mean values. ***Wilcoxon signed rank test against BL (P<0.001). (A) Site 1 and (B) site 2.
Abbreviations: BL, baseline; FU, follow-up.
Abbreviations: BL, baseline; FU, follow-up.
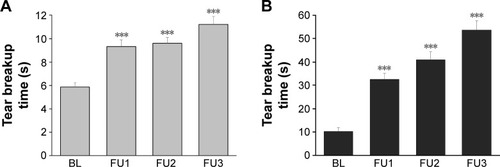
Table 2 Numerical analysis
Table 3 Categorical analysis
Figure 3 Forest plot of odds ratios for study measures.
Notes: Outcome measures were dichotomized as detailed in . Open circles and bars represent ORs and 95% confidence intervals, respectively. Green, blue, and black symbols show FU1 vs BL, FU2 vs BL, and FU3 vs BL, respectively. ORs for which the 95% confidence interval do not cross OR =1 are statistically significant. Undefined ORs are missing from this plot.
Abbreviations: BL, baseline; CFS, corneal fluorescein staining; FU, follow-up; LLT, lipid layer thickness; MGS, meibomian gland score; ORs, odds ratios; SPEED, Standard Patient Evaluation of Eye Dryness; TBUT, tear breakup time.
Abbreviations: BL, baseline; CFS, corneal fluorescein staining; FU, follow-up; LLT, lipid layer thickness; MGS, meibomian gland score; ORs, odds ratios; SPEED, Standard Patient Evaluation of Eye Dryness; TBUT, tear breakup time.
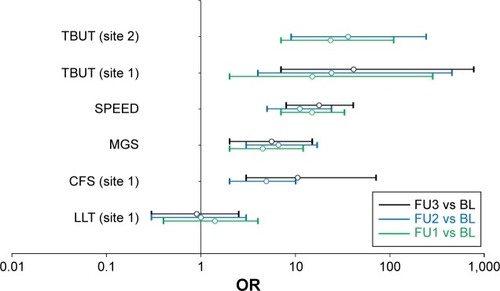
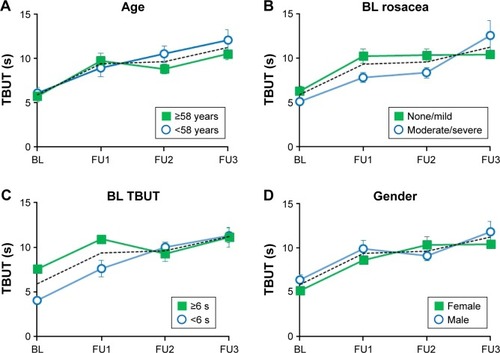
Figure 4 Subgroup analysis of TBUT (site 1).
Notes: In each panel, the dotted line shows the TBUT data for the complete cohort (38 eyes). (A) Effect of age. Solid squares: patients aged <58 years (n=18); open circles: patients aged >58 years (n=20). (B) Effect of baseline skin rosacea. Solid squares: patients with no or mild skin rosacea at BL (n=24); open circles: patients with moderate or severe skin rosacea at BL (n=14). (C) Effect of BL TBUT. Solid squares: eyes with TBUT ≥6 s (n=20); open circles: eyes with TBUT <6 s (n=18). (D) Effect of gender. Solid squares: females (n=16); open circles: males (n=22).
Abbreviations: BL, baseline; FU, follow-up; TBUT, tear breakup time.
Abbreviations: BL, baseline; FU, follow-up; TBUT, tear breakup time.