
Figures & data
Table 1 Demographic and testing characteristics of three study cohorts
Figure 1 A plot of within-subject standard deviation of the mean macular sensitivity against average of the three testing sessions for (A) glaucoma patients and (B) control subjects (including healthy and retinal patients showing weak relationship between variability and magnitude).
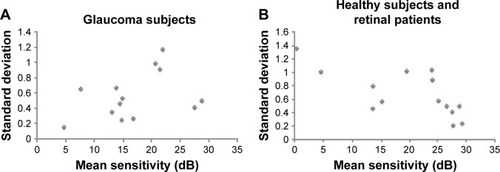
Figure 2 A plot of within-subject standard deviation of the point-wise sensitivity against average of the three testing sessions for (A) glaucoma patients and (B) control subjects (including healthy and retinal patients) showed increased variability when sensitivity dropped below 20 dB. Bland–Altman plot of differences against mean between testing sessions 2 and 3 for (C) glaucoma patients and (D) control subjects showed wider limits of agreement in glaucoma patients. Differences in point-wise sensitivity between testing sessions 1, 2, and 3 displayed as thresholds of second and third session against thresholds of first session show the increased spread of differences in (E) glaucoma and (F) control subjects as the baseline threshold decreases.
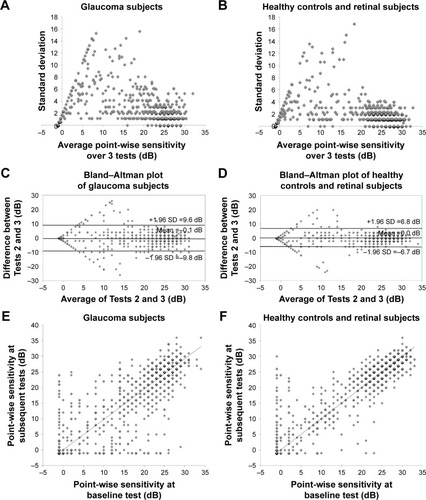
Table 2 CRs of single test loci across different levels of sensitivity
Table 3 Summary of previously reported values of intersession and intrasession test–retest variability of the MAIA device