
Figures & data
Figure 1 Baseline and follow-up best corrected visual acuity (BCVA) measured in both the groups.
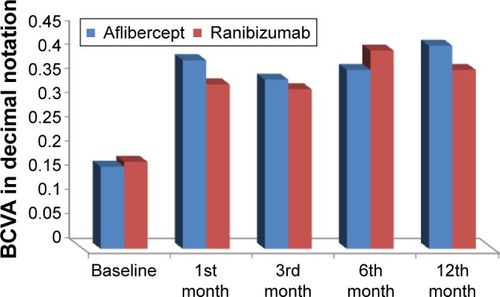
Figure 2 Changes in best corrected visual acuity (BCVA) in eyes of both the groups of the study.
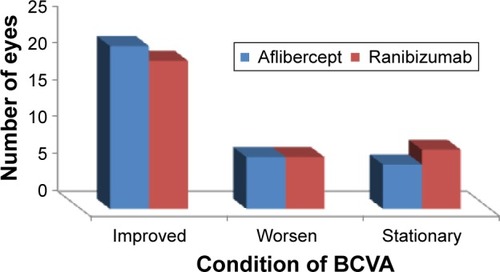
Table 1 Best corrected visual acuity (measured by Snellen decimal notation) at baseline and at benchmark follow-up visits in both the groups
Figure 3 Baseline and follow-up central macular thickness (CMT) measured in both the groups.
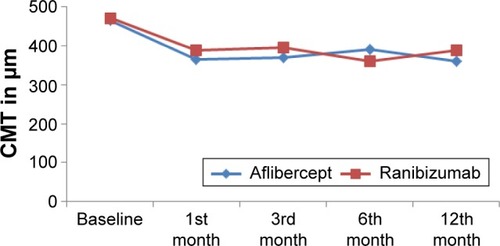
Table 2 Central macular thickness (measured in µm) at baseline and at benchmark follow-up visits in both the groups