
Figures & data
Figure 1 Patient disposition.
Notes:
aDue to adverse events not related to the drug, n (%): olopatadine HCl 0.77%, 4 (2.4); vehicle, 1 (0.9).
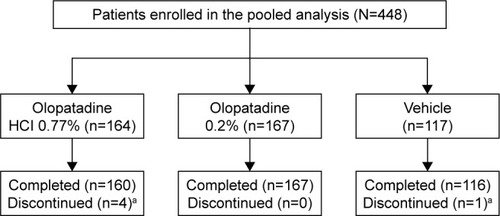
Table 1 Demographic and baseline characteristics (ITT population)
Figure 2 Ocular itching: treatment differences in least squares means at onset and 24 hours post-CAC.
Notes: *P<0.0001 overall and at all time points versus vehicle; **P<0.05 versus olopatadine 0.2%. The differences in least squares means for ocular itching between olopatadine 0.77% and vehicle were significant (P<0.0001) at all three post-CAC time points at onset and 24 hours. The differences in least squares means for ocular itching between olopatadine 0.77% and olopatadine 0.2% were significant (P<0.05) at all three post-CAC time points at 24 hours.
Abbreviation: CAC, conjunctival allergen challenge.
Abbreviation: CAC, conjunctival allergen challenge.
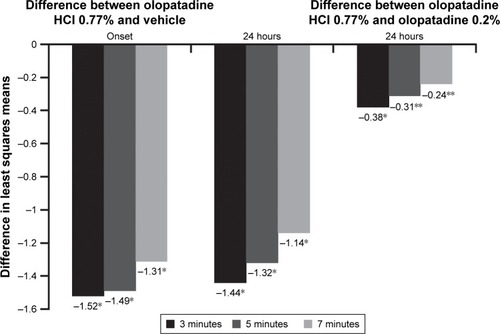
Figure 3 Conjunctival redness: treatment differences in least squares means at onset and 24 hours post-CAC.
Notes: *P<0.0001 overall and at all other time points versus vehicle; **P<0.05 overall and at all time points versus olopatadine 0.2%. The differences in least squares means for conjunctival redness between olopatadine 0.77% and both vehicle and olopatadine 0.2% were significant (P<0.05) at all three post-CAC time points at 7, 15, and 20 minutes.
Abbreviation: CAC, conjunctival allergen challenge.
Abbreviation: CAC, conjunctival allergen challenge.
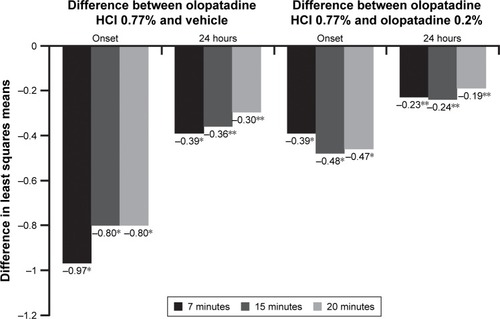
Figure 4 Total redness: treatment differences in least squares means at onset and 24 hours post-CAC.
Notes: *P<0.0001 overall and at all other time points versus vehicle; **P<0.05 overall and at all time points versus olopatadine 0.2%. The differences in least squares means for total redness between olopatadine 0.77% and both vehicle and olopatadine 0.2% were significant (P<0.05) at all three post-CAC time points at 7, 15, and 20 minutes.
Abbreviation: CAC, conjunctival allergen challenge.
Abbreviation: CAC, conjunctival allergen challenge.
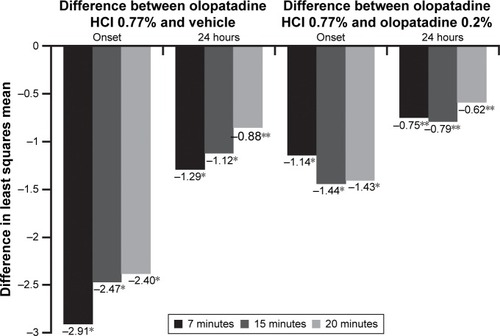
Figure 5 Itching responders: treatment differences in proportion of responders at 24 hour duration of action CAC or CAC 24 hours post treatment.
Notes: *P<0.0001 overall and at all other time points versus vehicle; **P=0.4142 at onset of action; ***P=0.0012 at 24 hours of CAC versus olopatadine 0.2%. The differences in least squares means for proportion of ocular itching responders between olopatadine 0.77% and vehicle at onset and 24 hours (P<0.0001) and between olopatadine 0.77% and olopatadine 0.2% at 24 hours (P=0.0012) were significant. A responder was defined as a patient with zero itch (a score of 0 on ocular itching for both the eyes) or with at least a 2-unit reduction in ocular itching relative to a baseline score. Two subjects (one in olopatadine 0.77% group, one in vehicle group) had missing data and were considered as nonresponders in this analysis. Ocular itching score was averaged across both the eyes and over the three post-CAC assessments (3, 5, and 7 minutes) for the calculation of unit reduction.
Abbreviation: CAC, conjunctival allergen challenge.
Abbreviation: CAC, conjunctival allergen challenge.
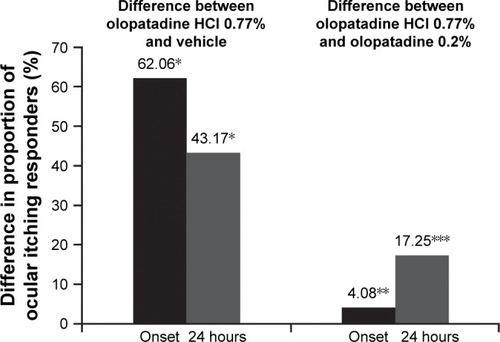
Table 2 Ocular signs and symptoms: treatment difference in means at onset and 24 hours post-CAC
Table 3 AEs (≥1% in any treatment group; safety set)