
Figures & data
Figure 1 Study design.
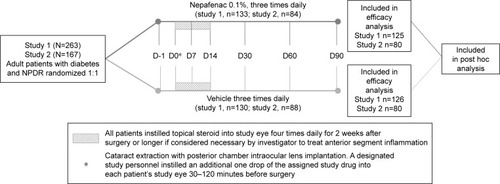
Table 1 Demographic and baseline characteristics of patients in each treatment group by individual study and pooled data (FAS)
Figure 2 Percentage of patients with BCVA improvement of ≥15 letters from preoperative baseline to Day 14 and maintained through Day 90 in each treatment group by individual study and pooled data (FAS).
Abbreviations: BCVA, best-corrected visual acuity; CI, confidence interval; FAS, full analysis set; OR, odds ratio; SE, standard error.
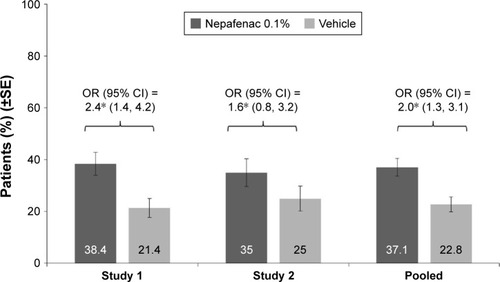
Figure 3 Percentage of patients with BCVA improvement of ≥15 letters from preoperative baseline and maintained through Day 90 in each treatment group by individual study and pooled data (FAS).
Abbreviations: BCVA, best-corrected visual acuity; CI, confidence interval; FAS, full analysis set; OR, odds ratio; SE, standard error.
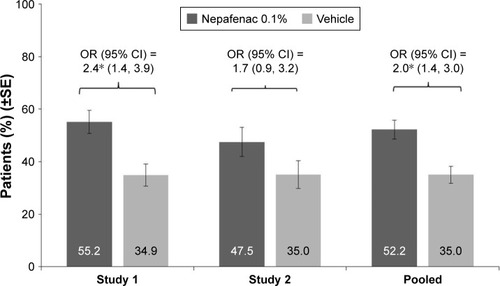
Figure 4 Percentage of patients with BCVA improvement of ≥15 letters from preoperative baseline and maintained through Day 60 in each treatment group by individual study and pooled data (FAS).
Abbreviations: BCVA, best-corrected visual acuity; CI, confidence interval; FAS, full analysis set; OR, odds ratio; SE, standard error.
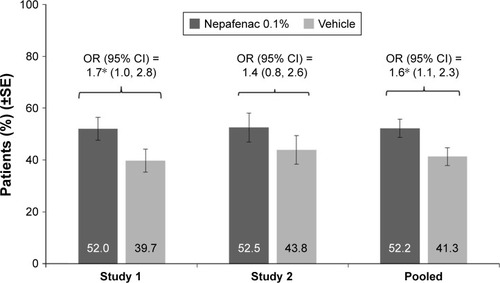
Table 2 Summary of BCVA outcomes in each treatment group by individual study and pooled data (FAS)
Table 3 Mean BCVA at baseline and at each postoperative visit in each treatment group by individual study and pooled data (FAS)