
Figures & data
Table 1 Comparison of responders and nonresponders in the study population
Table 2 Demographic characteristics of study subjects across various groups of AMD
Table 3 Prevalence and laterality of dry and wet AMD in study subjects
Table 4 Participant characteristics in early and late AMD among subjects with AMD
Figure 1 Visual status based on BCVA among the study subjects.
Abbreviations: BCVA, best-corrected visual acuity; AMD, age-related macular degeneration.
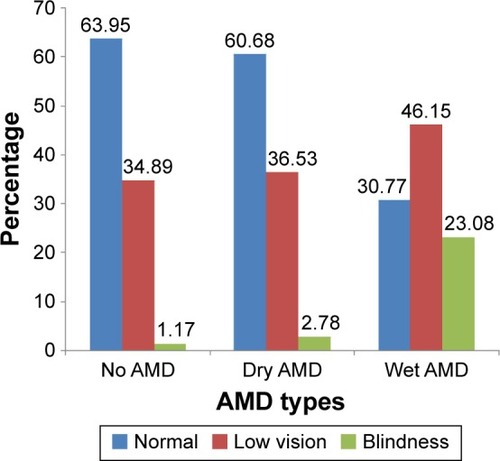
Table 5 Risk factors for AMD using logistic regression analysis