
Figures & data
Figure 1 Fundus images at two different wavelengths of light obtained by Oxymap T1 and the oxygen saturation map analyzed by Oxymap Analyzer.
Notes: Oxymap T1 simultaneously captures 50° monochrome images centered at the optic disk at two different wavelengths of light (570 nm and 600 nm): (A) 570 nm is the reference isosbestic wavelength that is insensitive to oxygen concentration and (B) 600 nm is the oxygen-sensitive wavelength. (C) Oxymap Analyzer automatically calculates the oxygen saturation in each selected vessel and produces a color oxygen saturation map. Retinal vessels with higher oxygen saturation are indicated with red to orange color. Green to purple color indicates the retinal vessels with lower oxygen saturation. (D) For the analysis, vessel selection was performed disk-centered, 1.5-disk to 3-disk diameter area, and 1 disk diameter away from the disk margin.
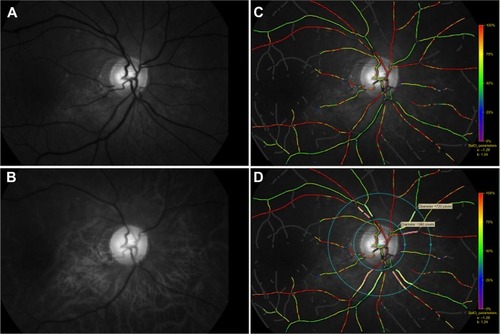
Table 1 Systemic and ocular characteristics of recruited population
Figure 2 Oxygen saturation in major retinal vessels before the surgery and 1 month and 6 months after the surgery.
Notes: Left graph: overall subjects; center graph: ERM subject; right graph: MH subject. Upper solid line: arterial saturation; middle solid line: venous saturation; lower broken line: A-V difference. *P<0.05, **P<0.01 compared before surgery.
Abbreviations: ERM, epiretinal membrane; MH, macular hole; A-V, arteriovenous; m, months.
Abbreviations: ERM, epiretinal membrane; MH, macular hole; A-V, arteriovenous; m, months.
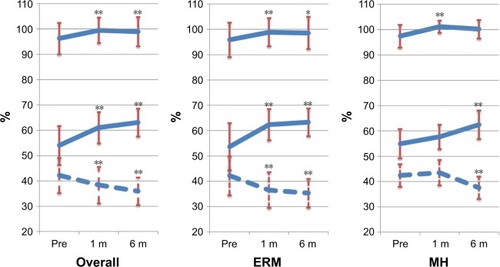
Table 2 Oxygen saturation in major retinal vessels before the surgery and 1 month and 6 months after the surgery
Figure 3 Vessel diameter before the surgery and 1 month and 6 months after the surgery.
Notes: Left graph: overall subjects; center graph: ERM subject; right graph: MH subject. Upper broken line: vein; lower solid line: artery. *P<0.05 compared before surgery.
Abbreviations: ERM, epiretinal membrane; MH, macular hole; m, months.
Abbreviations: ERM, epiretinal membrane; MH, macular hole; m, months.
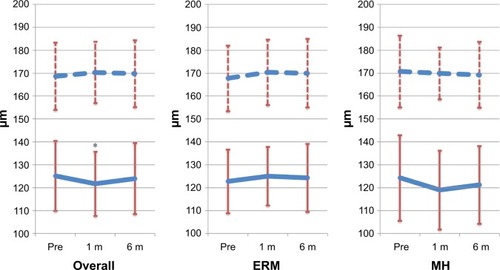
Table 3 Vessel diameter before the surgery and 1 month and 6 months after the surgery