Figures & data
Table 1 Tear film parameters for patients with a history of chalazion excision and control subjects
Figure 1 Representative images of an eye with a history of chalazion.
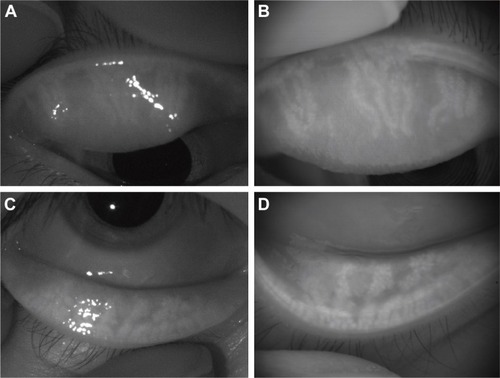
Table 2 Ratio of meibomian gland area to total analysis area using noncontact meibography equipped in a wavefront analyzer and in a slit-lamp microscope
Table 3 Meiboscores (median [interquartile range]) and frequency of meibomian gland dropout or shortening in patients with a history of chalazion excision and control subjects
Figure 2 Sequential wavefront color-coded maps of total ocular HOAs in a control subject and a representative patient with a history of chalazion.
Abbreviation: HOA, higher-order aberrations.
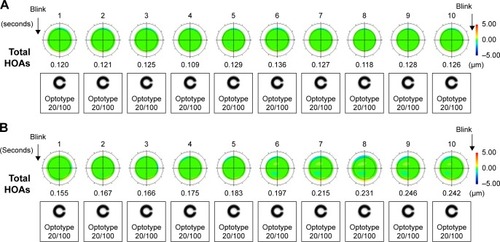
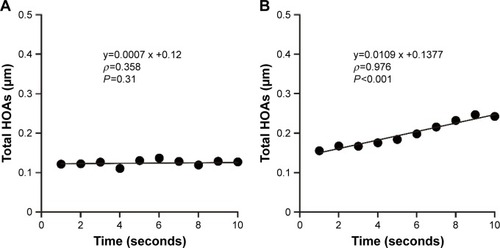
Figure 3 Sequential changes in total HOAs over 10 seconds after blinking and the corresponding linear regression curves for a control subject and a representative patient with a history of chalazion.
Abbreviations: HOAs, higher-order aberrations; SI, stability index.