
Figures & data
Figure 1 Bland–Altman plot of AL (preoperative).
Abbreviations: AL, axial length; SD, standard deviation.
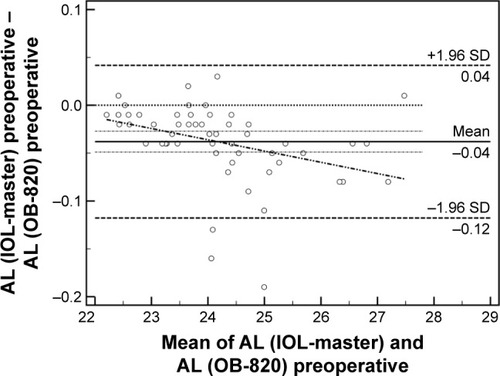
Figure 2 Bland–Altman plot of AL (postoperative).
Abbreviations: AL, axial length; SD, standard deviation.
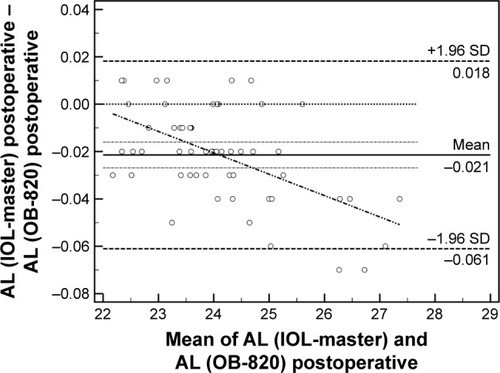
Figure 3 Bland–Altman plot of R2 (postoperative).
Note: R2, vertical corneal diameter.
Abbreviation: SD, standard deviation.
Abbreviation: SD, standard deviation.
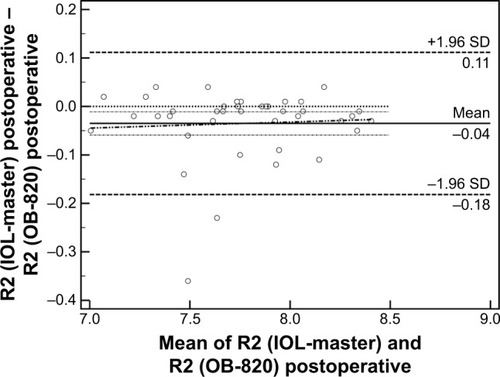
Figure 4 Bland–Altman plot of RSE (postoperative).
Abbreviations: RSE, radius/spherical equivalent; SD, standard deviation.
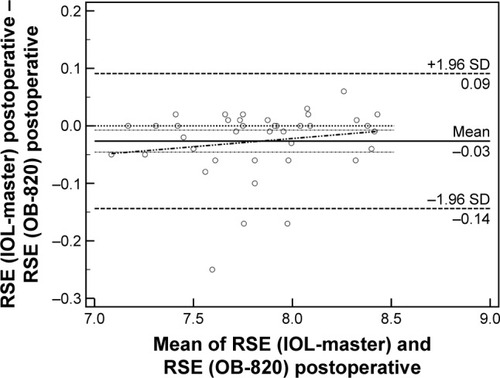
Table 1 Demographic characteristics of study participants
Table 2 Preoperative and postoperative values of measured parameters
Table 3 Comparisons of preoperative and postoperative differences