
Figures & data
Figure 1 The mean IOP during the perioperative period in each group.
Abbreviations: 25-P, 25-gauge phacovitrectomy; 25-A, 25-vitrectomy alone; 27-P, 27-gauge phacovitrectomy; 27-A, 27-vitrectomy alone; IOP, intraocular pressure; PreOp, preoperative day; POD, postoperative day; POW, postoperative week; POM, postoperative month.
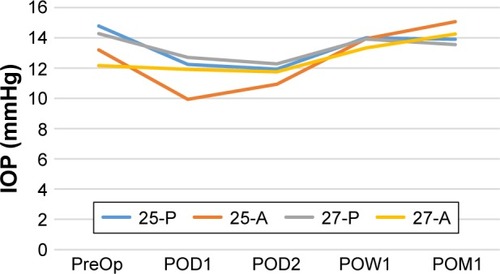
Table 1 Mean values for each factor in all of the groups
Table 2 Mean value of the IOP during the perioperative period and comparisons of the postoperative IOPs with the PreOp in each group