Figures & data
Figure 1 Mean postoperative pain intensity development measured by VAS (blue line) and NPRS (orange line) questionnaires.
Abbreviations: VAS, visual analog scale; NPRS, numeric pain rating scale.
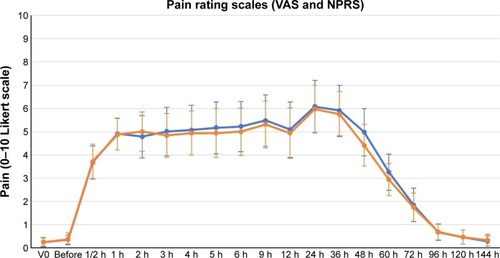
Figure 2 Postoperative pain intensity evolution by gender.
Notes: Females, black line; males, gray line.
Abbreviation: VAS, visual analog scale.
Abbreviation: VAS, visual analog scale.
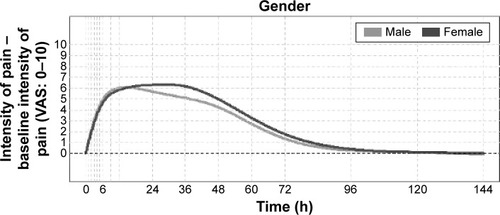
Figure 3 Postoperative pain intensity evolution by age.
Notes: >30 years old, black line; ≥25–30 years old, dark gray line; <25 years old, light gray line.
Abbreviation: VAS, visual analog scale.
Abbreviation: VAS, visual analog scale.
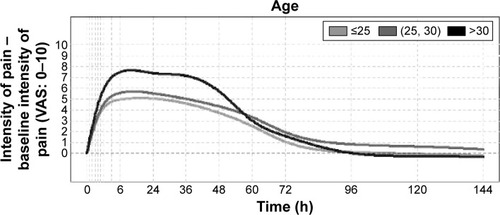
Figure 4 Overall pain level as estimated by PCA1.
Notes: (A) PCA1 accounted for 77.9% of the total pain variability. Mean postoperative pain evolution, black line; mean value +2 standard deviations, red line; mean value -2 standard deviations, blue line. (B) Extreme PCA1 scores. Mean postoperative pain evolution, black line. Five subjects with the highest PCA1 scores, red lines; five subjects with the lowest PCA1 scores, blue lines.
Abbreviation: PCA, principal component analysis.
Abbreviation: PCA, principal component analysis.
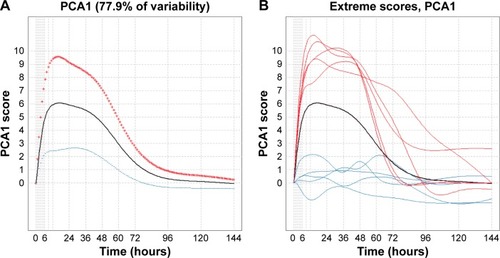
Figure 5 Recovery time estimated by PCA2.
Notes: (A) PCA2 accounted for 12.3% of the total pain variability. Mean postoperative recovery time evolution, black line; mean value +2 standard deviations, red line; mean value -2 standard deviations, blue line. (B) Extreme PCA1 scores. Mean postoperative recovery time evolution, black line. Five subjects with the highest PCA1 scores, red lines; five subjects with the lowest PCA1 scores, blue lines.
Abbreviation: PCA, principal component analysis.
Abbreviation: PCA, principal component analysis.
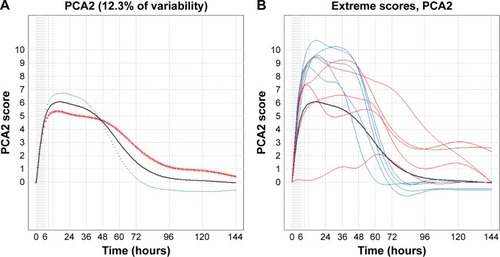
Figure 6 Postoperative pain intensity evolution by rescue medication.
Notes: Mean postoperative pain in the group that took rescue medication, black line. Mean postoperative pain in the group not taking rescue medication, gray line.
Abbreviation: VAS, visual analog scale.
Abbreviation: VAS, visual analog scale.
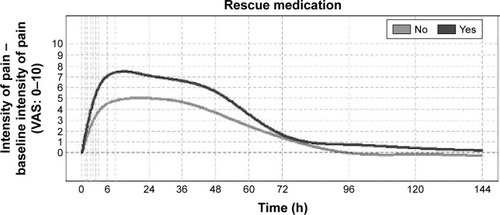
Table 1 Ocular symptoms reported by the patients before and after ASA, rated on a Likert scale of 4 points (from 0= no symptom to 3= worst imaginable symptom)
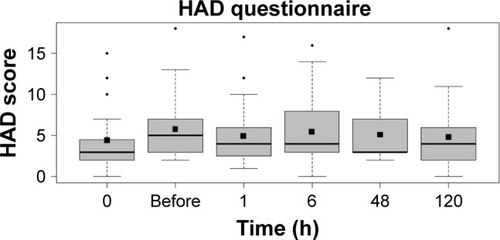
Figure 7 HAD questionnaire after ASA procedure.
Notes: Median values, black lines; mean values, black squares.
Abbreviations: ASA, advanced surface ablation; HAD, Hospital Anxiety and Depression.
Abbreviations: ASA, advanced surface ablation; HAD, Hospital Anxiety and Depression.