
Figures & data
Table 1 Patient demographics and average values of study parameters
Figure 1 Scatter plot demonstrating the correlation between the number of injections received and the age of the patients.
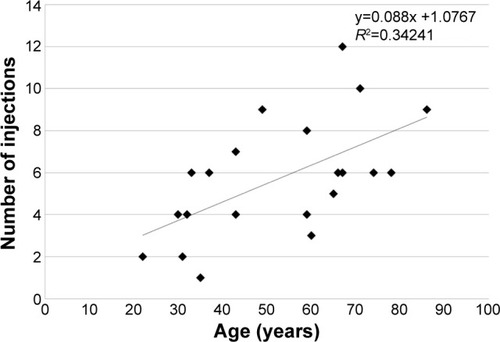
Figure 2 Scatter plot demonstrating the correlation between improvement in CDVA after treatment and the age of patients.
Abbreviations: CDVA, corrected distance visual acuity; ETDRS, early treatment of diabetic retinopathy study.
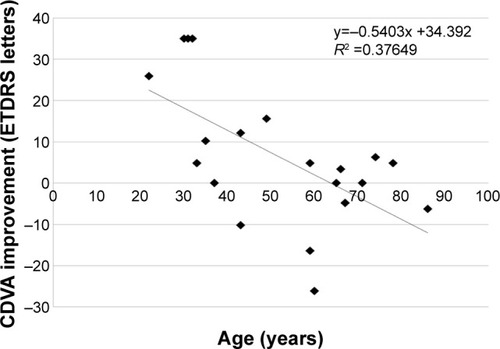
Table 2 Comparison of study parameters between the younger and the older age groups