Figures & data
Table 1 Patient demographics of the safety population
Figure 1 Decrease in diurnal IOP from baseline produced by travoprost and tafluprost. (intent-to-treat population, N = 48).
Note: *Travoprost showed a significantly larger decrease in IOP from baseline than tafluprost (P < 0.05).
Abbreviation: IOP, intraocular pressure.
Abbreviation: IOP, intraocular pressure.
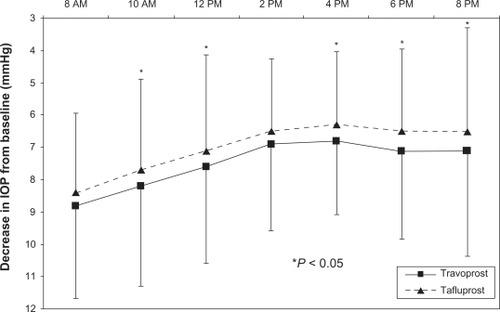
Table 2 Mean intraocular pressure at baseline and after six weeks of therapy with travoprost and tafluprost (intent-to-treat population, N = 48)
Table 3 Mean change from baseline on the symptom survey scores (based on a scale of 0–4) after six weeks of therapy with travoprost and tafluprost (intent-to-treat population, N = 48)