Figures & data
Table 1 Baseline demographic and clinical characteristics of the two study groups
Table 2 Comparison of final postoperative clinical conditions between the two groups
Table 3 Comparison of preoperative and postoperative clinical conditions within each group
Figure 1 IOP distribution in control group (30 eyes, blue line) and IVB group (9 eyes, green line) at various follow-up periods.
Notes: IOP decreased at all time points compared with preoperative IOP in both groups. However, the differences of IOP between the groups were not statistically significant at any period. Error bars: 95% CI.
Abbreviations: IVB, intravitreal bevacizumab; IOP, intraocular pressure; GDD, glaucoma drainage device; CI, confidence interval.
Abbreviations: IVB, intravitreal bevacizumab; IOP, intraocular pressure; GDD, glaucoma drainage device; CI, confidence interval.
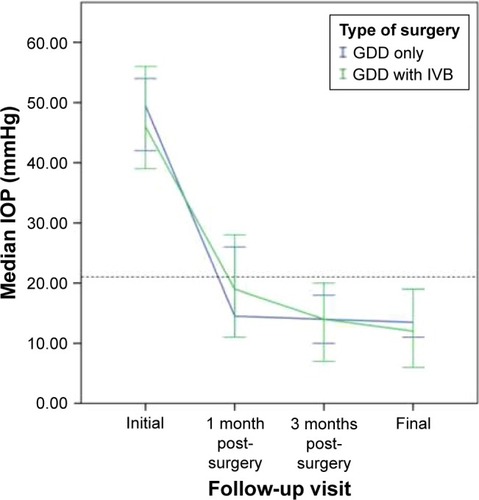
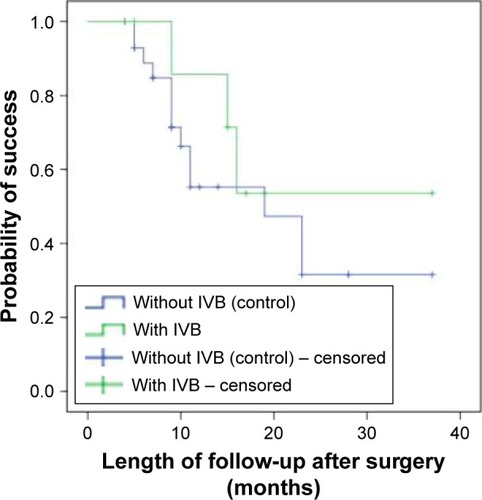
Figure 2 Cumulative probability of success after surgery in IVB group (9 eyes, green line) and control group (30 eyes, blue line) using Kaplan–Meier survival curve analysis.
Note: Log-rank test revealed no significant difference in the survival time between groups.
Abbreviation: IVB, intravitreal bevacizumab.
Abbreviation: IVB, intravitreal bevacizumab.