Figures & data
Figure 1 An intraoperative photo shows the internal components of the Argus II device including the coil, the electrode array, and the band which is positioned around the eye.
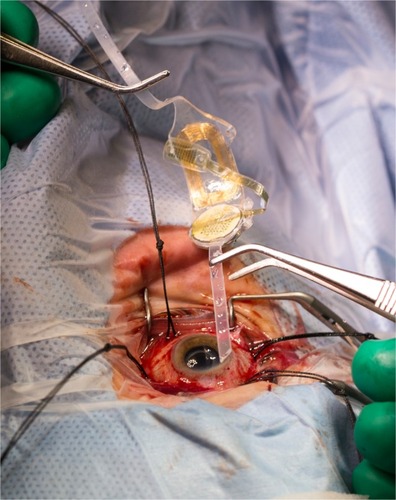
Figure 2 A patient wearing the Argus II device demonstrating the glasses and external coil on the side arm which transmits data between the device’s external and internal components (white arrow).
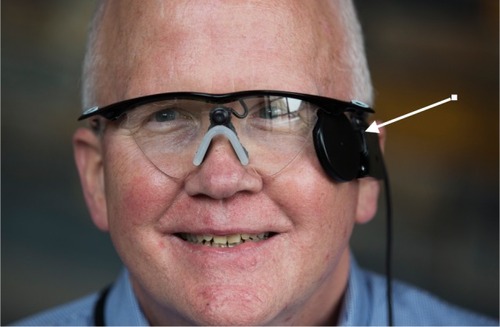
Figure 3 (A) Intraoperative view demonstrating the external band and coil sutured to the sclera. Black arrows point to the sutures tied from the external coil to the sclera. The cable has also been positioned through the sclerotomy. (B) Intraoperative view of tacking of the electrode array. (C) Post-operative fundus photo showing a well-positioned electrode array resting on the macula in a patient with retinitis pigmentosa. White arrow points out tack on the array.
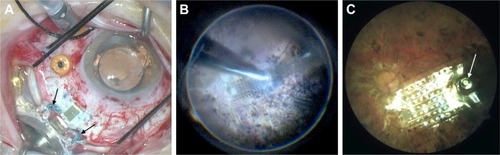
Figure 4 Post-operative optical coherence tomography shows a well-positioned electrode array in close apposition to the retinal surface.
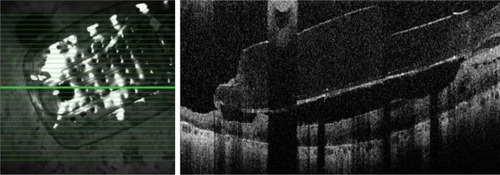
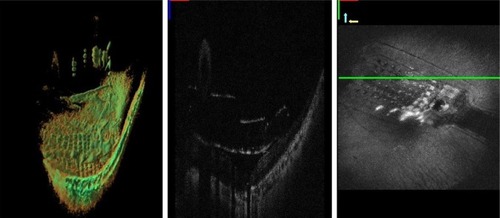
Figure 5 Microscope integrated intraoperative OCT images demonstrating the distance of the electrode array to the retinal surface during implantation.
Abbreviation: OCT, optical coherence tomography.