
Figures & data
Figure 1 Thick arrow in the fundus image refers to the same place where thin arrow points to the spectral domain optical coherence tomography scan.
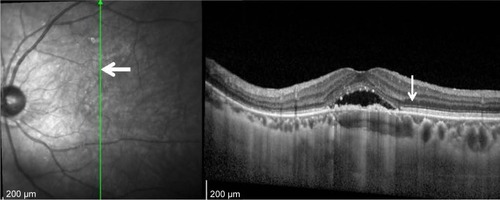
Figure 2 A representative case with chronic CSC.
Abbreviations: CSC, central serous chorioretinopathy; EZ, ellipsoid zone; M, months; PDT, photodynamic therapy; RPE, retinal pigment epithelium.
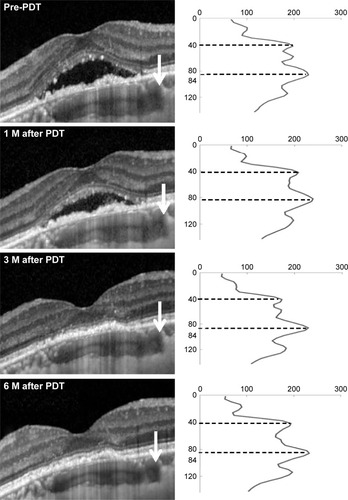
Figure 3 Serial changes in mean central IFT after half-fluence PDT in chronic central serous chorioretinopathy.
Abbreviations: IFT, inner foveal thickness; M, months; PDT, photodynamic therapy.
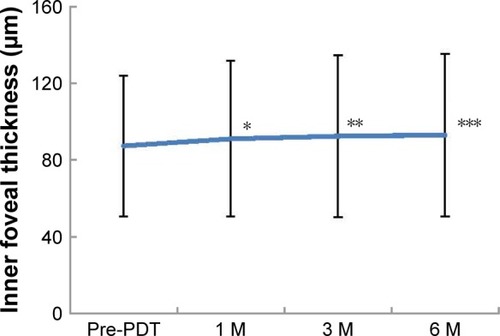
Figure 4 Serial changes in mean PROS length of the irradiated area after half-fluence PDT in chronic central serous chorioretinopathy.
Abbreviations: M, months; PDT, photodynamic therapy; PROS, photoreceptor outer segment.
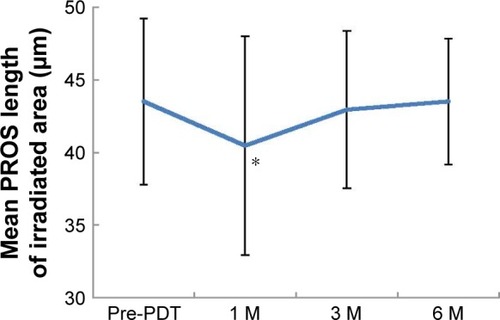
Figure 5 Serial changes in mean PROS length of nonirradiated area after half-fluence PDT in chronic central serous chorioretinopathy.
Abbreviations: M, months; PDT, photodynamic therapy; PROS, photoreceptor outer segment.
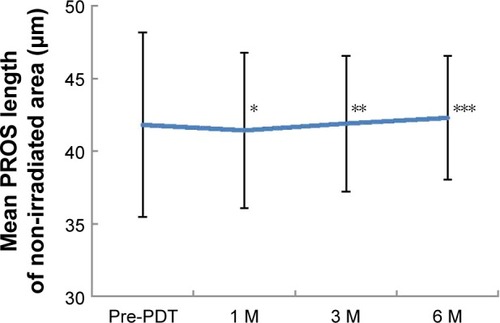
Table 1 Repeatability for inner foveal thickness, PROS length and choroidal thickness in CSC obtained using SD-OCT (n=21)
Table 2 Changes in inner foveal thickness after PDT (n=21)
Table 3 Changes in PROS length after PDT (n=21)
Table 4 Changes in PROS length after PDT in irradiated area in half-fluence and half-dose groups
Table 5 Changes in choroidal thickness after PDT (n=21)