Figures & data
Figure 1 (A) Anterior OCT: rabbit scleral thickness at the sclerotomy site (red arrow) and scleral thickness at a control site (red asterisk). The image on the right shows the place on the sclera where the OCT scan was made. (B) Schematic representation of CXL procedure details.
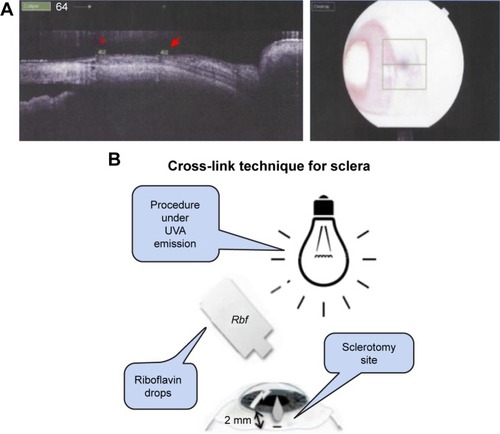
Figure 2 (A) Biomicroscopy at slit lamp: sclerotomy incision site (red arrows). (B) Box plot chart. Analysis of ImageJ measurements of the sclerotomy incisions. Statistical data of paired Student’s t-test. Significant results (P<0.05). (C) Table with the sclerotomy measurements per area through the ImageJ software.
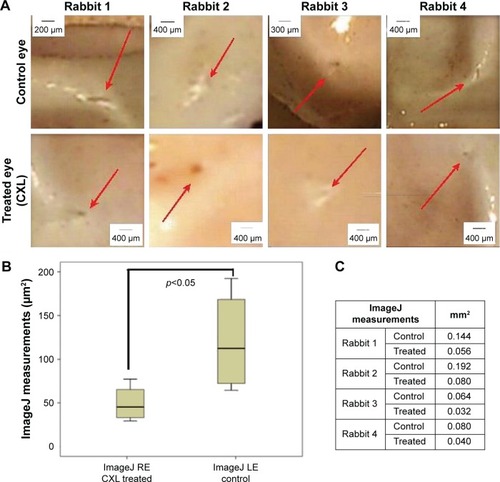
Figure 3 (A) Box plot chart. Scleral thickness measurements in treated and control eye with anterior OCT (in vivo) and with the digital caliper (measurement: postmortem). Statistical analysis performed with ICC test revealed showed a significant result. (B) Table with scleral thickness data.
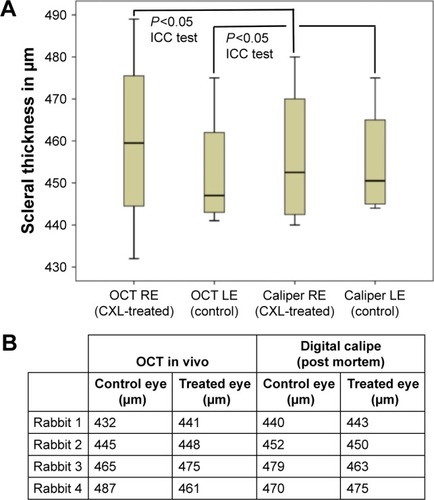
Figure 4 HE staining. Treated (CXL) and control eyes.
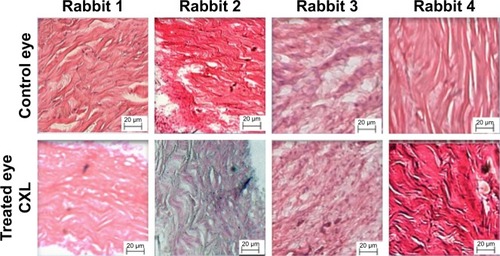
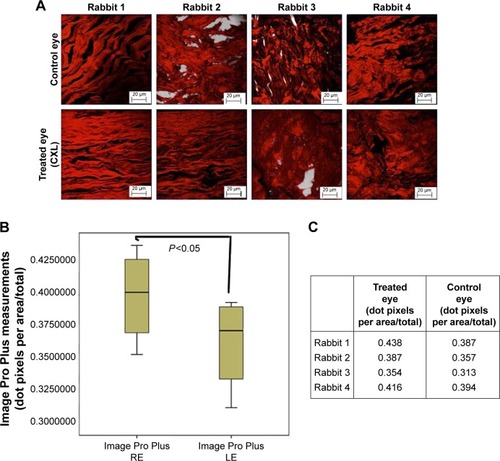
Figure 5 (A) Collagen fibers stained with PR in treated and control eyes. (B) Box plot chart showing the collagen fiber density through Image Pro Plus of the two eyes. Abscise axis measured in density dot pixels (dot pixels per area/total). (C) Image Pro Plus measurements.