Figures & data
Figure 1 The flow chart for the disc segmentation algorithm.
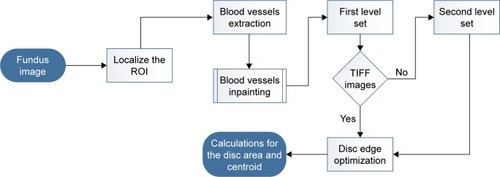
Figure 2 The disc segmentation procedure for TIFF images (MESSIDOR and Magrabi). (A) Localized image; (B) inpainted image; (C) segmented disc boundaries; (D) optimized disc.
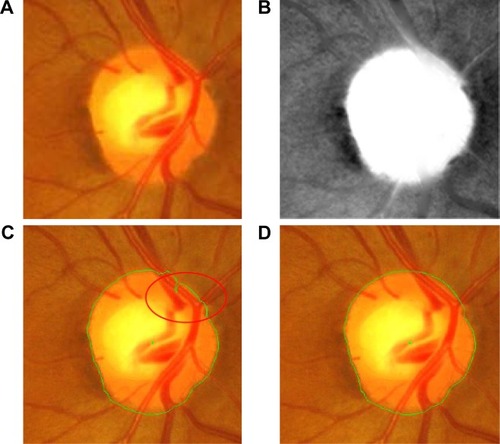
Figure 3 The disc segmentation procedure for JPG images (Bin Rushed): (A) localized fundus image, (B) inpainted image, (C) first level set, (D) the localized image based on the first level set (is split from the middle), (E) second level set, (F) optimized disc contour.
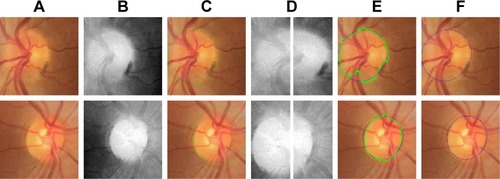
Figure 4 Flowchart for the analysis of disc segmentation.
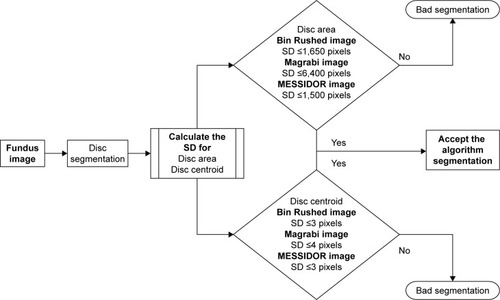
Figure 5 Examples of good disc segmentation results for both TIFF (MESSIDOR and Magrabi) and JPG (Bin Rushed) images comparing with those of six ophthalmologists.
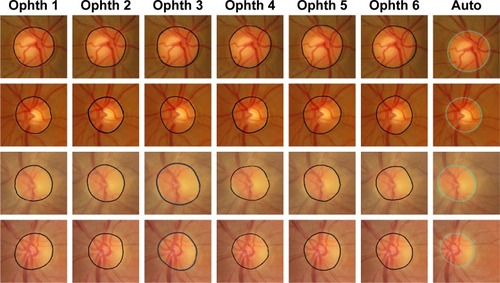
Figure 6 Examples of bad disc segmentation results for both TIFF (MESSIDOR and Magrabi) and JPG (Bin Rushed) images comparing with those of six ophthalmologists.
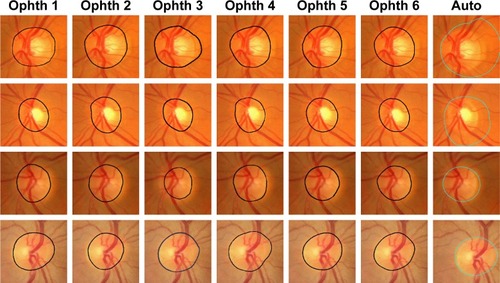
Table 1 Results of disc segmentation for Bin Rushed dataset
Table 2 The disc accuracy results for the six ophthalmologists and the segmentation algorithm for Bin Rushed dataset
Table 3 Results of disc segmentation for Magrabi dataset
Table 4 The disc accuracy results for the six ophthalmologists and the segmentation algorithm for Magrabi images set
Table 5 Results of disc segmentation for MESSIDOR dataset
Table 6 The disc accuracy results for the six ophthalmologists and the segmentation algorithm for MESSIDOR dataset
Table 7 Results of disc segmentation for all three datasets combined
Table 8 Results of disc segmentation by the six ophthalmologists and the algorithm for all three datasets combined
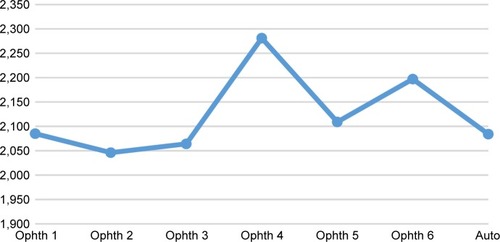
Figure 7 The disc accuracy results for all six ophthalmologists as well as the algorithm for the three datasets separately and combined.
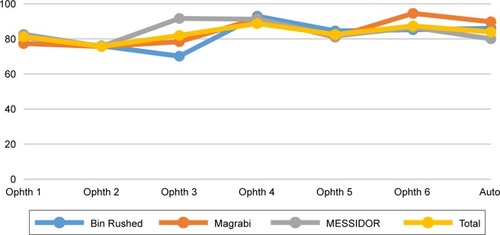
Table 9 The number of images with disc agreement between the ophthalmologists as well as the algorithm
Figure 8 The disc agreement results for the six ophthalmologists as well as the algorithm for all datasets combined together.
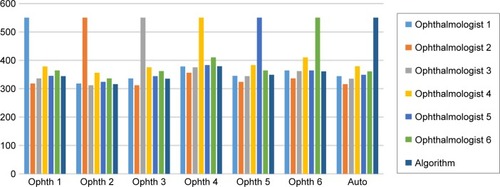
Figure 9 The disc agreement results for the six ophthalmologists as well as the algorithm for all datasets.