Figures & data
Figure 1 Retinal OCT images showing six layers and their thicknesses highlighted in different colors.
Abbreviations: GCL, ganglion cell layer; INL, inner nuclear layer; IS, inner segment layer; OCT, optical coherence tomography; ONL, outer nuclear layer; OPL, outer plexiform layer; RNFL, retinal nerve fiber layer; RPE, retinal pigment epithelium.
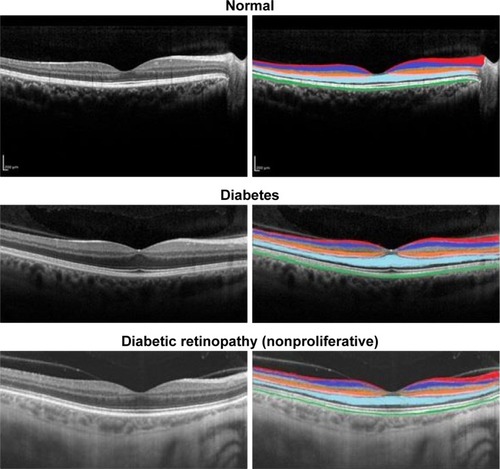
Table 1 Features considered during OCT image analysis
Figure 2 LDA score plot of OCT intensity and textural features using 20 principal components after PCA–LDA, with the confidence ellipse representing confidence interval at 95%.
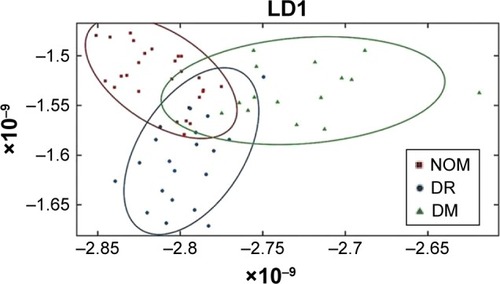
Figure 3 (A) Schematic diagram showing the first bifurcation point of the superior and inferior arterioles originating from the optic disk, considered during tortuosity, radius of curvature, and curvature measurement. (B) Clinically, two lines crossing vertically through the center of the optic disk, one from 12 o’clock to 6 o’clock and the other from 3 o’clock to 9 o’clock, were taken to define the four quadrants clockwise, namely, superior nasal (1), superior temporal (2), inferior temporal (3) and inferior nasal (4).
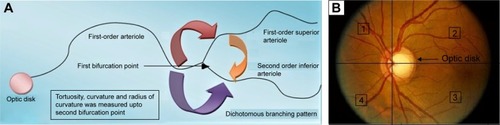
Figure 4 Mean FTIR spectra of the whole region (400–4,000 cm−1).
Abbreviations: au, arbitrary unit; DM, diabetes mellitus; DR, diabetic retinopathy; FTIR, Fourier transform infrared; LDA, linear discriminant analysis; LD1, linear discriminant 1; LD2, linear discriminant 2; NOM, normal; PCA, principal component analysis; RBBC, rubber band-like baseline correction.
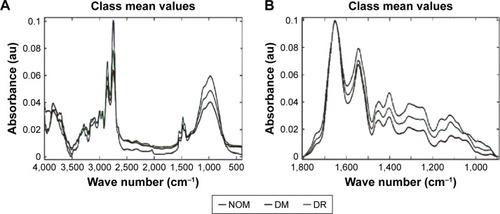
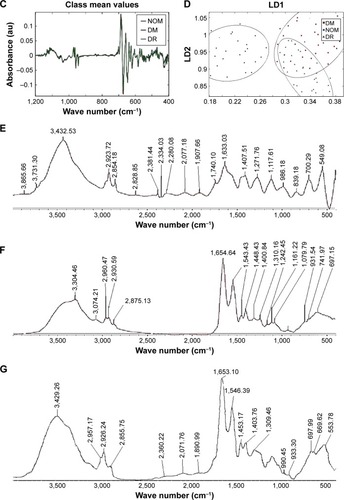
Figure 5 Confusion matrix of multiclass disease classification using intensity and textural features extracted from retinal OCT images by cubic SVM at 10-fold cross-validation.
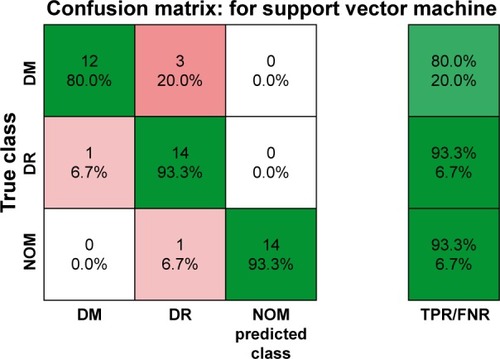
Table 2 Irrelevant features identified from OCT images after sequential feature reduction technique using Weka during QIB selection
Figure 6 Interconnected box plots showing intraretinal layer thickness measurements (in micrometers) in the pericentral area of the macula in patients with type 2 diabetes with no DR (DM) or DR compared to normal healthy individuals (NOM).
Abbreviations: DR, diabetic retinopathy; DM, diabetes mellitus; GCL, ganglion cell layer; INL, inner nuclear layer; IS, inner segment layer; NOM, normal healthy condition; ONL, outer nuclear layer; OPL, outer plexiform layer; RNFL, retinal nerve fiber layer; RPE, retinal pigment epithelium.
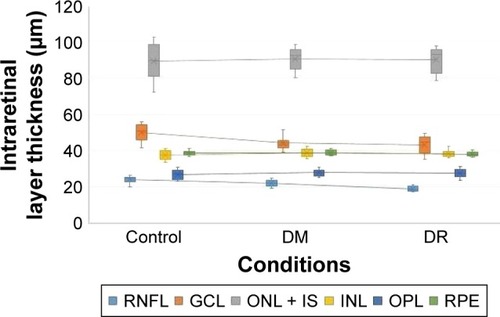
Table 3 Mean intraretinal layer thickness measurements (in micrometers) in the pericentral area of the macula in patients with type 2 diabetes with no DR and in patients with DR compared to healthy individuals
Figure 7 Box plots showing differences among the groups.
Abbreviations: NOM, normal healthy condition; DM, diabetes mellitus; DR, diabetic retinopathy.
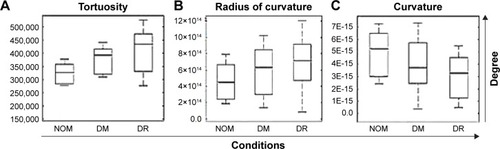
Table 4 Classification performance of alternates of SVM based on texture and intensity attributes extracted from OCT images
Figure 8 Schematic diagram showing (A) abnormal polyol metabolism in progressive retinal neurodegeneration and development of diabetic retinopathy; (B) impaired retinol metabolism, and (C) role of UDP-Glc-NAc in progressive neuroretinal degeneration.
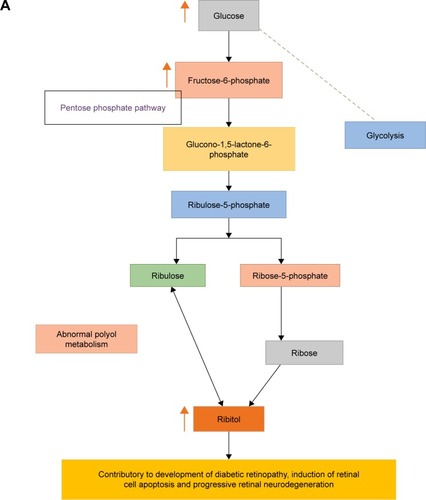
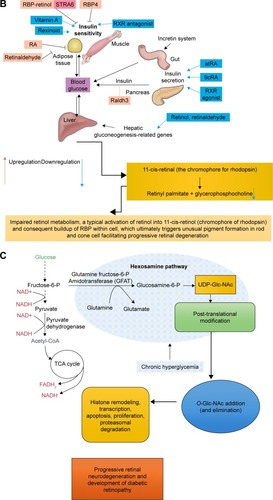
Figure 9 Stacked 1H-NMRspectra.
Abbreviations: DM, diabetes mellitus; DR, diabetic retinopathy; UDP-Glc-NAc, uridine 5′-diphosphate-N-acetyl glucosamine.
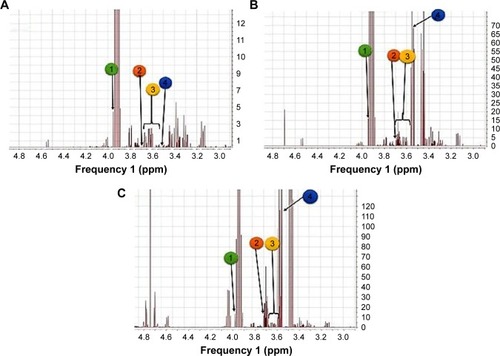
Figure 10 ROC curve generated from the 1H-NMR spectral data to identify serum metabolomic biomarkers for neuroretinal degeneration.
Abbreviations: AUC, area under the curve; DM, diabetes mellitus; DR, diabetic retinopathy; NMR, nuclear magnetic resonance; ROC, receiver operating characteristic; UDP-Glc-NAc, uridine 5′-diphosphate-N-acetyl glucosamine.
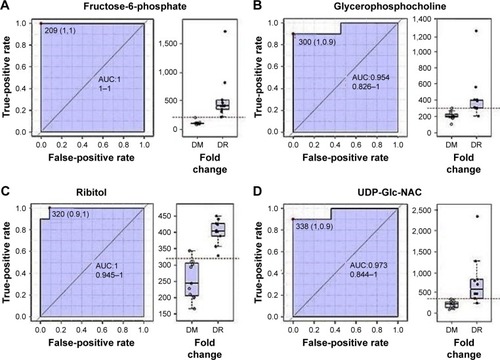
Table 5 Chemical shifts of major metabolites identified in 1H-NMR spectra through comparison with HMDB
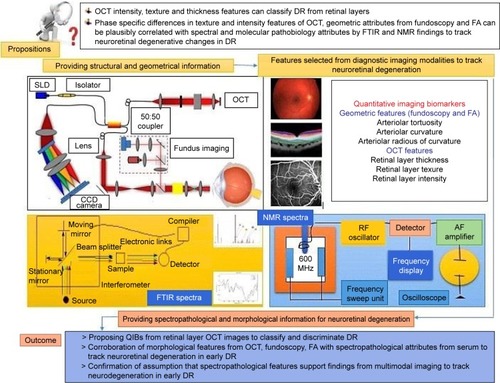
Figure 11 Representation of multimodal characterization of retinal layers with plausible spectropathological information validating the complementarity of approaches.
Abbreviations: AF, automated fragmentation; CCD, charge-coupled device; DM, diabetes mellitus; DR, diabetic retinopathy; FA, fluorescein angiography; FTIR, Fourier transform infrared; NMR, nuclear magnetic resonance; OCT, optical coherence tomography; QIB, quantitative imaging biomarker; RF, radio frequency; SLD, superluminescent diode.