Figures & data
Figure 1 Appearance of subretinal bleb containing palucorcel injection immediately after completion of the injection of the cellular product at the time of surgery.
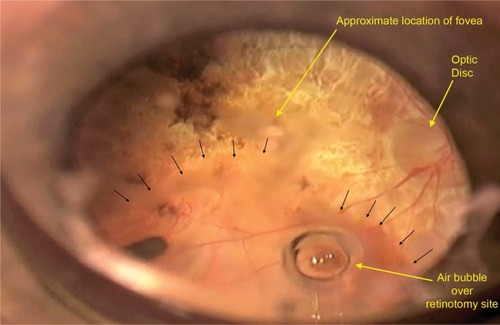
Figure 2 Fundus photographs of the subject’s eye (A, B) before the procedure and (C, D) at 5 weeks after surgery.a
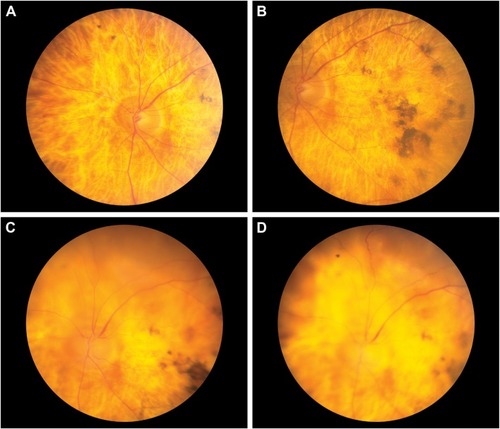
Figure 3 Epiretinal membrane immunocytochemistry analysis using (A, B) a combination of anti-vimentin (green), anti-neurofilament (red), ricin (blue), and Hoescht (white) and (C, D) a combination of anti-vimentin (green), anti-ezrin (red), ricin (blue), and Hoescht (white).
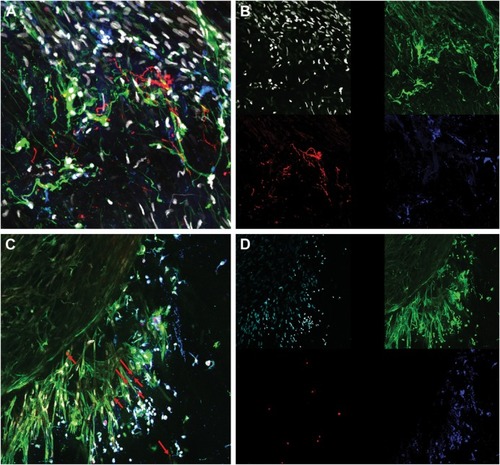
Figure 4 Epiretinal membrane immunocytochemistry analysis using (A, B) a combination of anti-vimentin (green), anti-GFAP (red), ricin (blue), and Hoescht (white) and (C, D) a combination of anti-vimentin (green), anti-Mib1 (red), ricin (blue), and Hoescht (white).
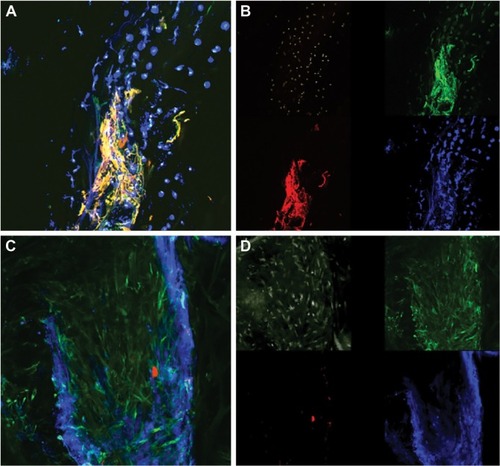
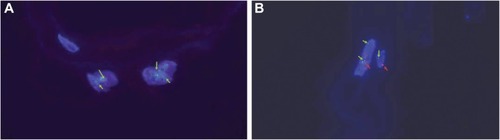
Figure 5 Fluorescence in situ hybridization staining of the epiretinal membrane using (A) an X (green arrows) chromosome probe and (B) X (green arrows) and Y (red arrows) chromosome probes.a