
Figures & data
Table 1 Treatment groups
Table 2 Baseline demographic and disease characteristics (full analysis set)
Figure 1 Mean change in BCVA for (A) COPERNICUS and GALILEO and (B) integrated data set from baseline to week 24 (LOCF).
Abbreviations: BCVA, best-corrected visual acuity; ETDRS, Early Treatment Diabetic Retinopathy Study; LOCF, last observation carried forward.
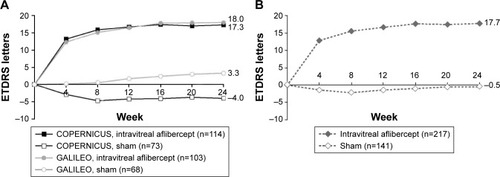
Figure 2 Mean change in BCVA from baseline to week 24–week 52 (LOCF).
Abbreviations: BCVA, best-corrected visual acuity; ETDRS, Early Treatment Diabetic Retinopathy Study; LOCF, last observation carried forward.
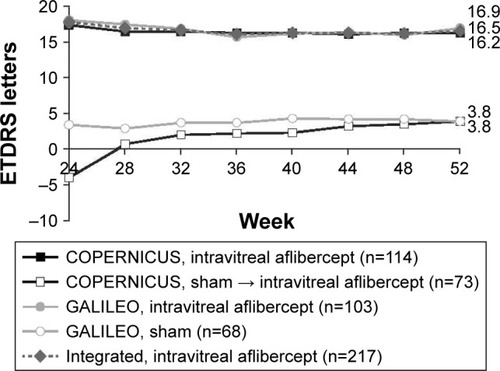
Figure 3 Mean change in CRT for (A) COPERNICUS and GALILEO and (B) integrated data set from baseline to week 24 (LOCF).
Abbreviations: CRT, central retinal thickness; LOCF, last observation carried forward.
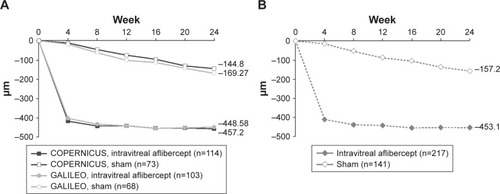
Figure 4 Mean change in CRT from baseline to week 24–week 52 (LOCF).
Abbreviations: CRT, central retinal thickness; LOCF, last observation carried forward.
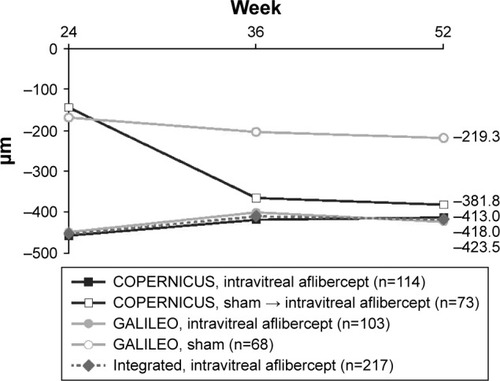
Table 3 Ocular SAEs from baseline to week 52 by MedDRA Preferred Term (safety analysis set)
Table 4 APTC-ATEs from baseline to week 52 (safety analysis set)