Figures & data
Figure 1 The time course of logarithm of the minimum angle of resolution (logMAR) visual acuity (VA) for the vitreomacular adhesion (VMA) (+) group (A) and VMA (−) group (B).
Notes: Over the 1-year period, three cases markedly worsened in the VMA (+) group, while only one case markedly worsened in the VMA (−) group.
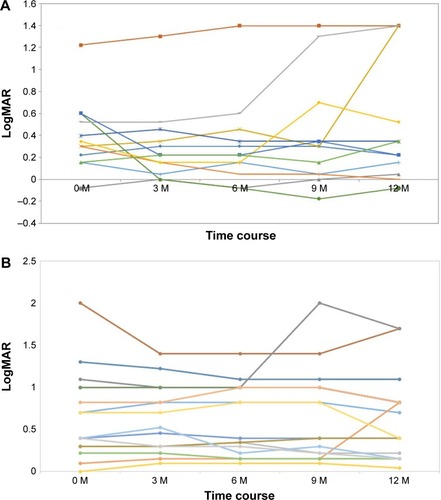
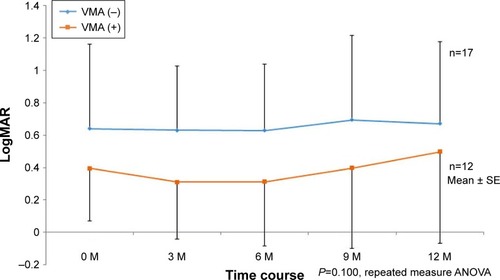
Figure 2 The transformation of the mean logarithm of the minimum angle of resolution (logMAR) visual acuity change after the first ranibizumab injection.
Notes: No significant difference was found between the two groups.
Abbreviations: VMA, vitreomacular adhesion; ANOVA, analysis of variance; SE, standard error.
Abbreviations: VMA, vitreomacular adhesion; ANOVA, analysis of variance; SE, standard error.