Figures & data
Table 1 Patient demographics and results
Figure 1 Top: Normal Spectralis spectral domain optical coherence tomography (SD OCT) image with intact photoreceptor inner segment/outer segment junction (IS/OS). Bottom: Spectralis SD OCT from the left eye of patient 10 showing the “flying saucer” sign of hydroxychloroquine retinopathy, an ovoid appearance of the central fovea created by preservation of central foveal outer retinal structures (seen between the black arrows) surrounded by perifoveal loss of the photoreceptor IS/OS junction, and perifoveal outer retinal thinning.
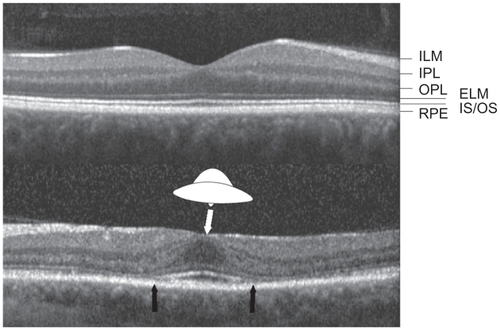
Figure 2 Spectral domain optical coherence tomography (SD OCT) images taken with different commercially available SD OCT machines demonstrate the “flying saucer” sign is consistent in different individuals with hydroxychloroquine retinopathy. A) Heidelberg Spectralis SD OCT in patient 9, OD. B) Zeiss Cirrus SD OCT in patient 9, OD. C) Heidelberg Spectralis SD OCT in patient 4, OS. D) Zeiss Cirrus SD OCT in patient 4, OS.
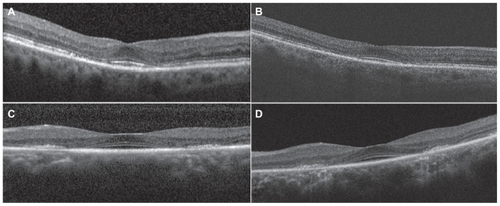
Figure 3 Spectral domain optical coherence tomography (SD OCT), red-free photo, fundus autofluorescence, and early and late fluorescein angiogram in patient 10, who had no symptoms, normal clinical exam and fundus autofluorescence imaging, Humphrey visual field 10-2 with paracentral scotomas, and “flying saucer” sign seen on SD OCT.
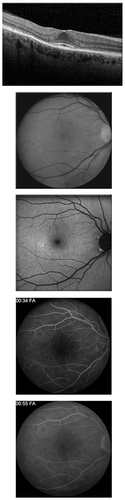
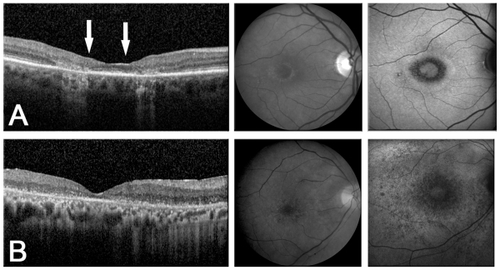
Figure 4 Spectral domain optical coherence tomography (SD OCT) images, red-free photos, and fundus autofluorescence (FAF) demonstrate a spectrum of findings seen with different stages of hydroxychloroquine retinopathy. Note the increased signal of choroidal vessels on SD OCT as the retina becomes increasingly atrophic with progressive toxicity starting from early toxicity in patient 10 seen in . A) Moderate toxicity. Patient 24: vision loss, clinical bull’s eye maculopathy even more apparent on FAF, Humphrey visual field (HVF) 10-2 paracentral scotomas, and significant perifoveal outer retinal dropout but preservation of central photoreceptor inner segment/outer segment junction (between the arrows) seen on SD OCT allowing 20/40 vision. B) Late toxicity. Patient 18: severe vision loss to hand motion, pronounced clinical and FAF bull’s eye maculopathy, dense HVF 10-2 paracentral scotomas, and complete disruption of outer retinal structures on SD OCT.