Figures & data
Figure 1 Distribution of 1-month and 3-month postoperative binocular visual outcomes.
Abbreviations: UDVA, uncorrected distance visual acuity; UIVA, uncorrected intermediate visual acuity; UNVA, uncorrected near visual acuity.
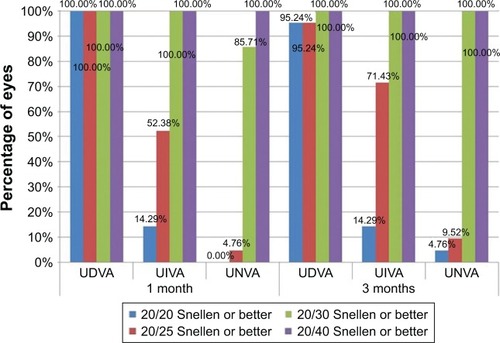
Table 1 Postoperative monocular visual outcome
Table 2 Postoperative binocular visual outcome
Table 3 Three-month postoperative binocular reading speed and acuity outcomes
Figure 2 Three-month postoperative photopic (A) and mesopic (B) contrast sensitivity.
Note: The gray areas represent the normal ranges of similar age groups under photopic and mesopic conditions.Citation10
Abbreviations: CS, contrast sensitivity; cpd, cycles per degree.
Abbreviations: CS, contrast sensitivity; cpd, cycles per degree.
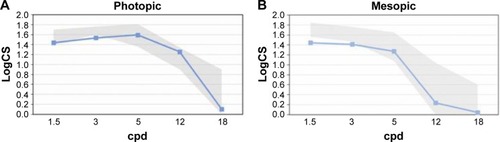
Figure 3 Three-month postoperative patient satisfaction with the achieved visual quality at far, intermediate, and near distances.
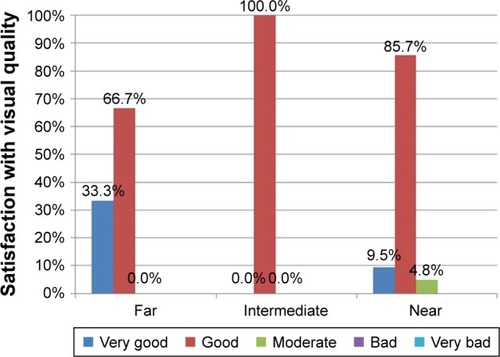
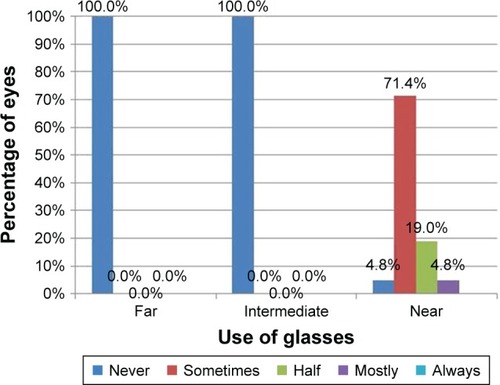
Figure 4 Postoperative frequency of spectacle use at far, intermediate, and distances.