Figures & data
Figure 1 Negative electroretinogram at six months (1991 and 1992). Case 1. White photopic electroretinogram of the right eye. Case 2. White photopic electroretinogram of the left eye.
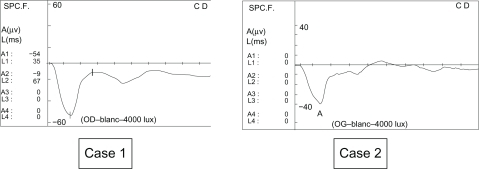
Figure 2 Electroretinograms stayed negative when they were controlled in 2002 (Case 1, 11 years; Case 2, 10 years). Case 1. Negative profile of the photopic electroretinogram with white flash (b-wave amplitude) 37.8 V in the right eye and 43.1 V in the right eye). Case 2. Negative profile of the photopic electroretinogram with white flash (b-wave amplitude 24.2 V in the right eye and 24.8 V in the left eye).
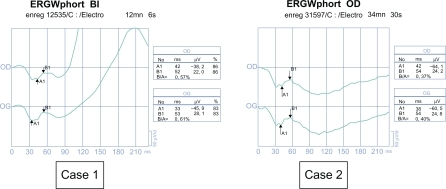
Figure 3 Red arrows indicate the dark trough (first arrow) and the light peak (second arrow) and the red line along the x axis indicates the duration that the background light is on. Case 1. Altered electro-oculogram in the left eye because of esotropia, and subnormal electro-oculogram with Arden ratio 66% on the right eye, probably due to the nystagmus being raised on monocular vision. Case 2. Both eyes are normal (Arden ratio 192% and 212%). The normal value of the Arden ratio is over 185%.
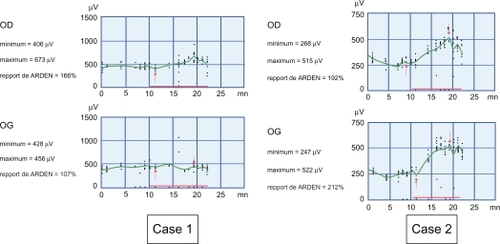
Figure 4 Lowered rod response recordable.
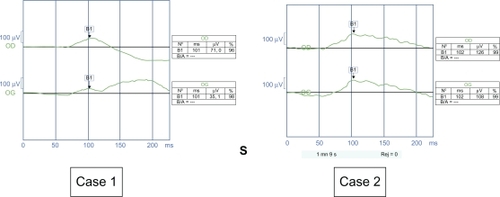
Figure 5 Negative profile of the mixed response.
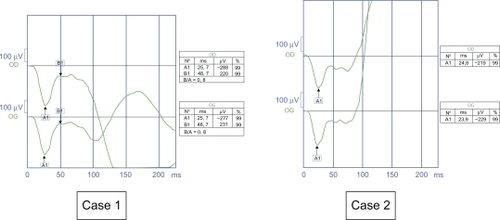
Figure 6 Case 1. Negative profile and b-wave amplitude is 20.2 μV on the right eye, 20.7 μV in the left eye, in the range of those of incomplete congenital night stationary blindness. Case 2. Negative profile and b wave amplitude is 16.2 μV and on the left eye, and 32.1 μV on the right eye but in the range of complete congenital night stationary blindness.
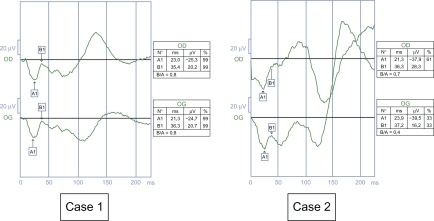
Figure 7 Case 1. Amplitude of the flicker response is 12.3 μV in the right eye and 16.2 in the left eye. Case 2. Amplitude of the flicker response is 2.6 μV in the right eye and 2.8 μV in the left eye. These results are compatible with incomplete congenital night stationary blindness.
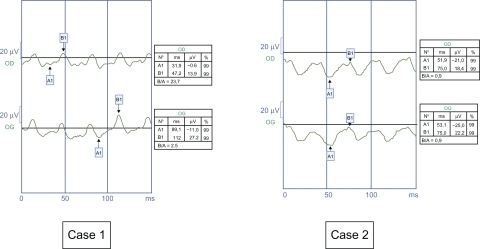
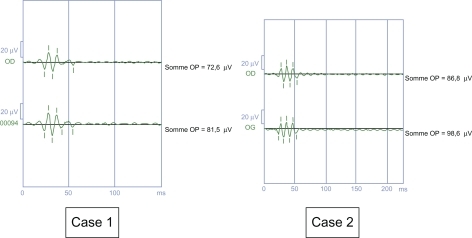
Figure 8 Reduction of oscillatory potentials, the lowest being phot-OP 4.