
Figures & data
Table 1 IOL types in first and second eyes
Figure 1 Distribution of preoperative manifest spherical equivalent.
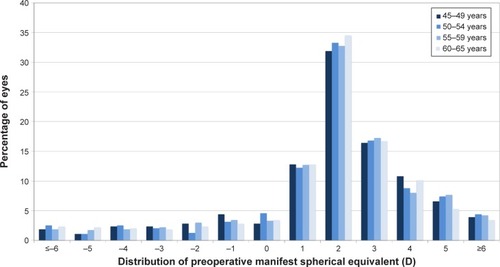
Table 2 Preoperative and postoperative clinical data
Figure 2 Refractive outcomes: distribution of 3 month postoperative manifest spherical equivalent.
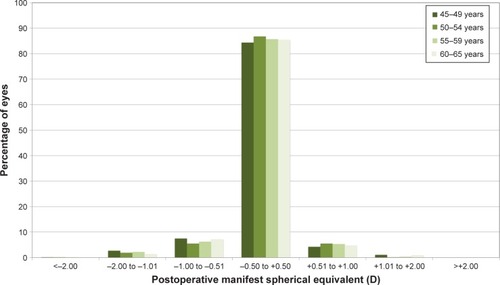
Figure 3 Cumulative monocular uncorrected distance visual acuity.
Note: Follow-up 3 months.
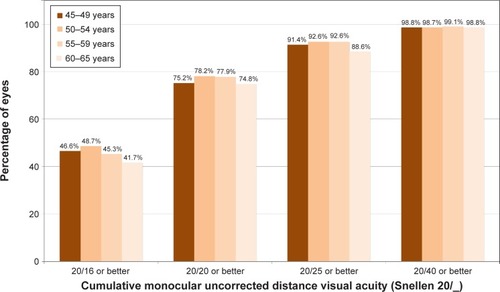
Figure 4 Cumulative monocular uncorrected near visual acuity.
Note: Follow-up 3 months.
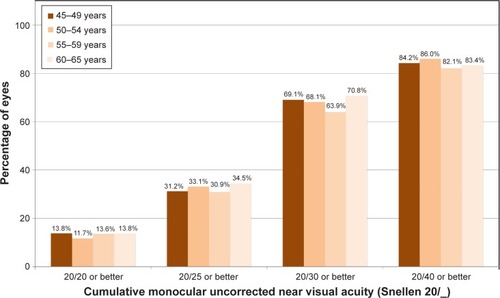
Figure 5 Comparison of preoperative and postoperative corrected distance visual acuity.
Note: Follow-up 3 months.
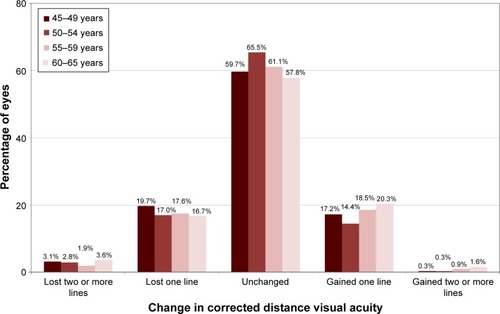
Table 3 IOL explants
Table 4 Postoperative complications
Table S1 Postoperative patient-reported outcomes according to age category
Table S2 Patient-reported outcomes: difference between postoperative and preoperative scores