Figures & data
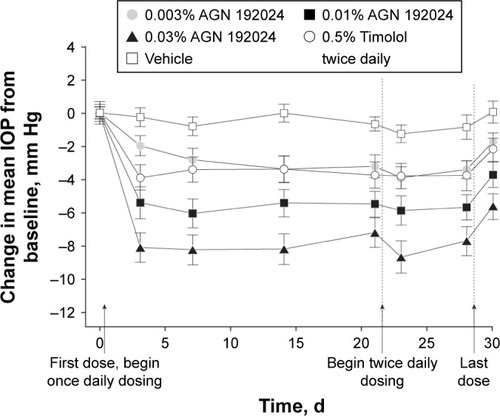
Figure 1 Mean concentration of bimatoprost acid in the aqueous humor (A, B) and iris-ciliary body (C, D) of New Zealand White rabbits following once- or twice-daily administration of topical bimatoprost 0.01% or dual fixed-combination bimatoprost 0.01%/brimonidine 0.1% ophthalmic solutions. In the aqueous humor and iris-ciliary body, the lower limits of detection were 0.1 ng/mL and 1.75 ng/g, respectively. aAdministered once daily for 4 days. bAdministered twice daily on days 1 to 3, and once on day 4.
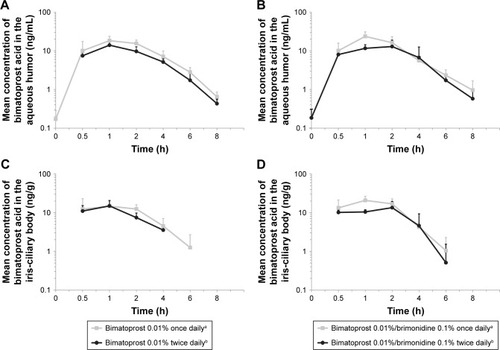
Table 1 Pharmacokinetic profile of bimatoprost acid in the aqueous humor and iris-ciliary body of New Zealand White rabbits following once- or twice-daily administration of topical bimatoprost 0.01% or dual fixed-combination bimatoprost 0.01%/brimonidine 0.1% ophthalmic solutions
Table 2 Incidence of Grade 1 conjunctival hyperemia in New Zealand White rabbits following BID or QD treatment with topical bimatoprost 0.01% or fixed-combination bimatoprost 0.01%/brimonidine 0.1%Table Footnotea
Figure 2 Mean (SE) change from baseline intraocular pressure (IOP) at 8 am. A significant decrease (P≤.001) in mean IOP from baseline (day 0) was seen in all active treatment groups during the once-daily (days 1 through 21) and twice-daily (days 22 through 28) phases of the study. Baseline mean IOP ranged from 24.5 to 27.0 mm Hg among groups (P=.94). The mean decrease from baseline IOP in the 0.03% AGN 192024 group was significantly greater (P≤.02) than that in the 0.5% timolol twice-daily group at every study visit except on day 21. The mean decrease from baseline IOP in the 0.01% AGN 192024 group was also significantly greater (P≤.04) than that with timolol at all study visits except those on days 3 and 30 (2 days following the last dose). Reproduced with permission from Arch Ophthalmol. 2001;119(7):994–1000. Copyright © (2001) American Medical Association. All rights reserved.Citation32 AGN 192024 was developed by Allergan plc.