
Figures & data
Figure 1 Clear corneal phacoemulsification (A) and Vicryl 6/0 traction suture (B).
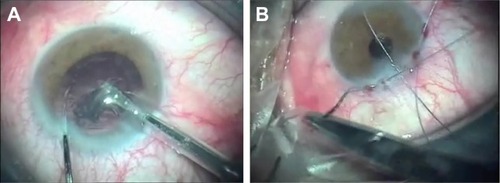
Figure 2 Creation of superficial scleral flap.
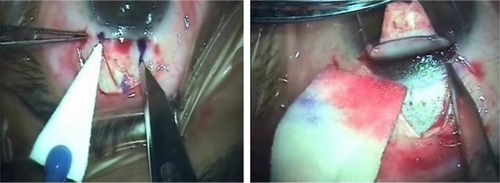
Figure 3 Creation of deep scleral flap.
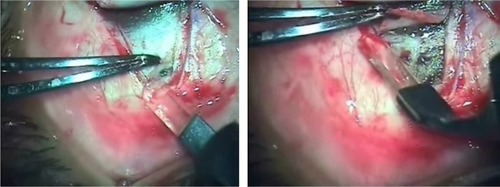
Figure 4 Advancing microcatheter through SC (A) followed by Prolene suture placement (B).
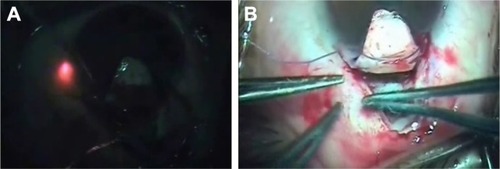
Figure 5 Closure of superficial scleral flap (A) and conjunctiva (B).
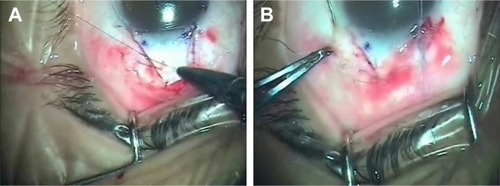
Table 1 Patient demographics and baseline characteristics
Figure 6 IOP preoperatively and at 3, 6, and 12 months postoperatively.
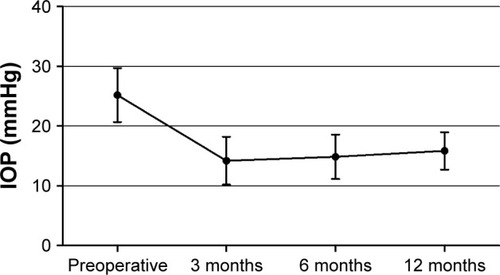
Table 2 IOP at baseline, 3, 6, and 12 months posttreatment
Figure 7 One week after surgery: clear cornea and no bleb.
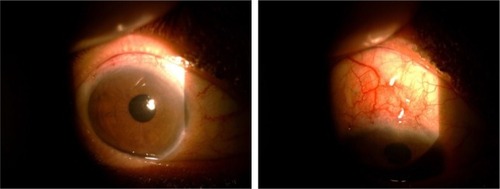
Figure 8 Three months after surgery: coapted sclera flap and no bleb.
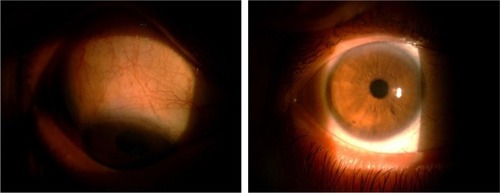
Figure 9 Visual acuity at baseline, 3, 6, and 12 months post-treatment.
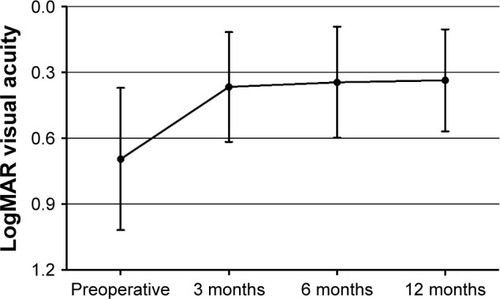
Table 3 Visual acuity at baseline, 3, 6, and 12 months post-treatment