Figures & data
Figure 1 Representative images of the chorioretinal blood flow taken by a LSFG instrument with a SBR. A) Before TES. Squares were positioned in three different areas: the rim of the optic disc flanked by two branched vessels crossing the margin of optic disc. This area was selected so that there were no blood vessels. The other two areas were a point midway between the optic disc and macula and the macula area. The macula area was identified by the region without retinal vessels. B) Twenty-four hours after TES. The averaged SBR values within the square for each measurement are indicated below the square. The color map of chorioretinal blood flow shows an increase of blood flow after TES. In all areas, the chorioretinal blood flow was increased, especially in the midway point.
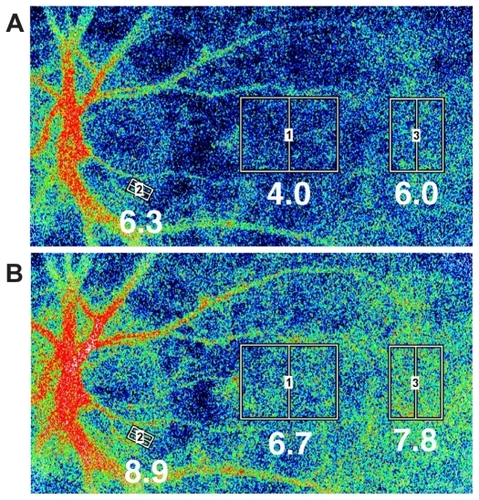
Figure 2 Changes of the mean standardized blur ratio in volunteers with (n = 6) or without (n = 4) TES (mean ± SEM). Dash lines indicate the TES group and solid lines the sham stimulation group. A) In optic disc area, there were no significant differences between the sham stimulation and TES at any times. B) However, for the point located midway between the optic disc and macula, the mean standardized blur ratio was significantly increased at immediate, 3, and 24 h after TES. C) Similarly in the macula area, the mean standardized blur ratio was significantly increased at 3 and 24 h after TES.
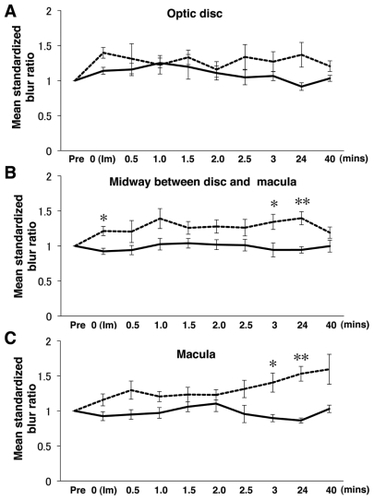
Table 1 Time course of standardized blur ratio after TES in optic disc and macula
Table 2 Changes of ocular and systemic parameters in the subjects with TES or sham stimulation