
Figures & data
Table 1 Participant characteristics, stratified by sex
Figure 1 Box and whisker plot of questionnaire items with the eight highest rated preoperative anxieties.
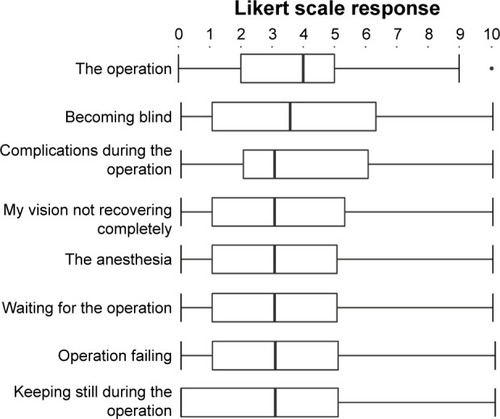
Figure 2 Top anxieties recalled after completion of the preoperative survey; N=56, with five patients citing anxiety due to other factors or declining to rank-order.
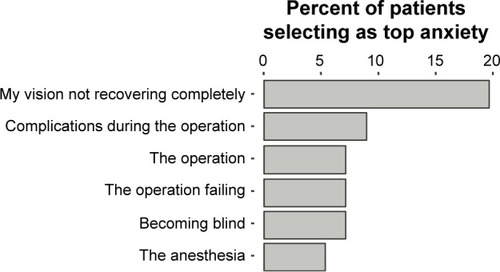
Figure 3 Pre- and postoperative comparisons for questionnaire items demonstrating a statistically significant decline at the postoperative survey (p<0.05, Wilcoxon rank-sum test).
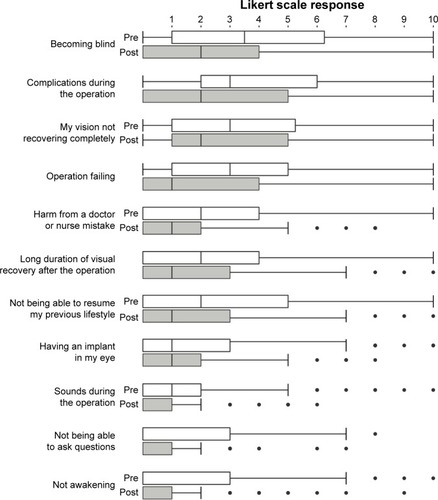
Table 2 Selected patient quotes per time period
Table S1 Means, medians, and interquartile ranges of all survey question responses, stratified by survey administration relative to the operative period