
Figures & data
Table 1 Patient characteristics, IOP data, and visual field data
Figure 1 Distribution of number of eyes in which consecutive decrease in MD value was observed.
Notes: Of 130 eyes in which consecutive decrease in MD value was observed during the follow-up period, the number of two consecutive was 57 eyes (43.8%). Three consecutive and four or more consecutive was observed in 39 eyes (30.0%) and 34 eyes (26.2%), respectively.
Abbreviation: MD, mean deviation.
Abbreviation: MD, mean deviation.
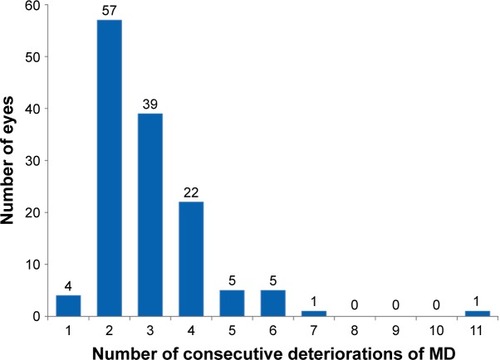
Figure 2 Distribution of number of eyes with MD slope value at the final visual field test.
Notes: At the final visual field test, significantly negative MD slope was observed in 80 (59.7%: red column) of 134 eyes, but MD slope deterioration was not significant in 54 eyes (40.3%: blue column). All 21 eyes with MD slope of lower than −0.4 dB/year showed significant deterioration. Of 102 eyes with MD slope was less than −0.4 dB/year, however, 59 eyes (57.8%) appeared to be significant MD slope deterioration.
Abbreviation: MD, mean deviation.
Abbreviation: MD, mean deviation.
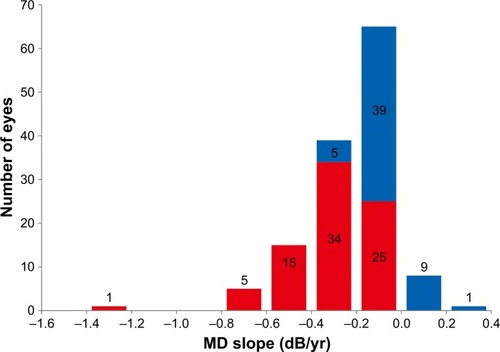
Table 2 Results of trend analysis and univariate logistic regression analysis
Table 3 Comparison of variables between groups with and without MD slope deterioration
Table 4 Results of multivariate logistic regression analysis