
Figures & data
Figure 1 Location of TIA, ACD and LV is shown in an SS-OCT image. The ICA tool is shown which had to be placed manually on the scleral spur by the operator which then displayed the lines measuring the anterior chamber morphometric data displayed in the tables. (A) An open anterior chamber. (B) Angle closure with shallow ACD. In both images, TIA is displayed in green, ACD in blue and LV in pink.
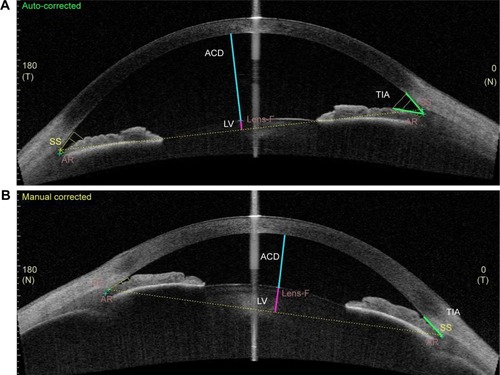
Figure 2 Distribution of the (A) TIA500, (B) ACD and (C) LV on the right phakic eyes.
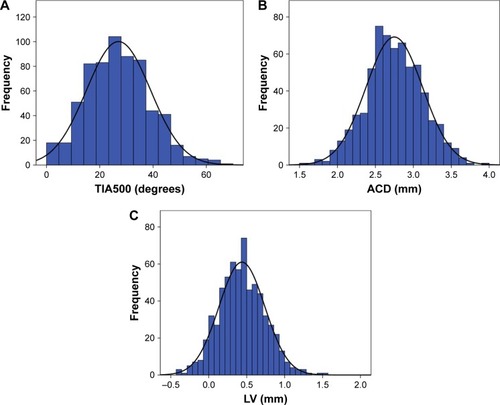
Figure 3 Flowchart of inclusion and exclusion of study participants.
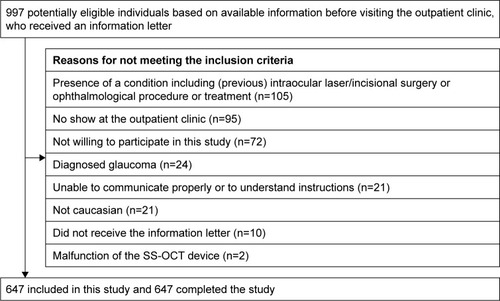
Table 1 Temporal TIA500 in the right phakic eyes (SS-OCT)
Table 2 Nasal TIA500 in the right phakic eyes (SS-OCT)
Table 3 ACD in the right phakic eyes (SS-OCT)
Table 4 LV in the right phakic eyes (SS-OCT)