Figures & data
Table 1 Characteristics of eligible patients
Figure 1 (A) Frequency distribution and average LOS in the study population. (B) LOS by all four surgeons (EDD, GD, JB, and RJL). (C) Correlation between patient age and LOS. (D) The average LOS in different age groups in P/K and Epi groups. (E) The average LOS by each surgeon in femtosecond laser and manual cataract surgery.
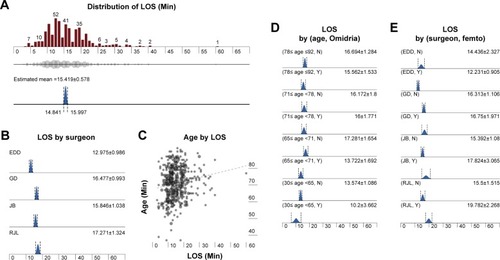
Figure 2 (A) Complication rate in eyes with or without mydriatic-assist device use. (B) Complication rate in P/K and Epi groups. (C) Complication rate with or without mydriatic-assist device use in P/K and Epi groups.
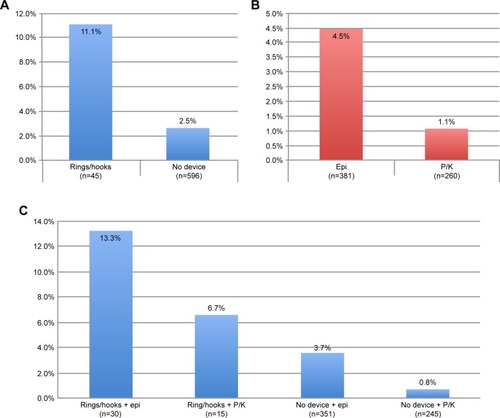
Figure 3 (A) Mydriatic-assist device rate in eyes that underwent femtosecond laser-assisted cataract surgery and manual surgery. (B) Mydriatic-assist device rate by each surgeon in P/K and Epi groups. (C) Mydriatic-assist device rate in patients with or without history of α1 antagonist use in P/K and Epi groups.
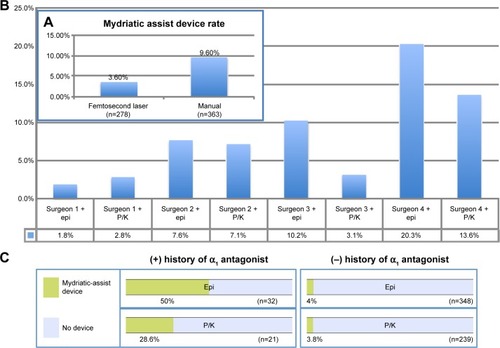
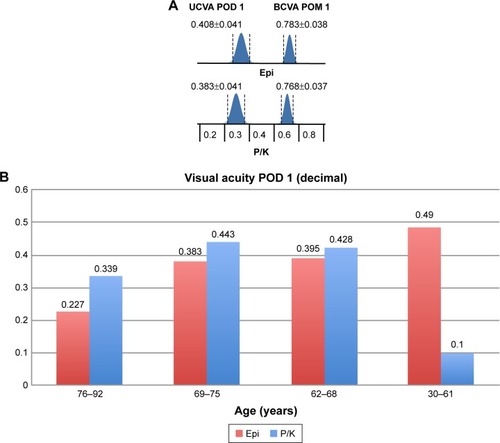
Figure 4 (A) UCVA at POD 1 and BCVA at POM 1 in P/K and Epi groups. (B) POD 1 UCVA in different age groups in P/K and Epi groups.