Figures & data
Figure 1 Preoperative LogMAR score of both groups. Group A, temporal approach; Group B - supereior approach.
Abbreviation: LogMAR, logarithm of the minimum angle of resolution.
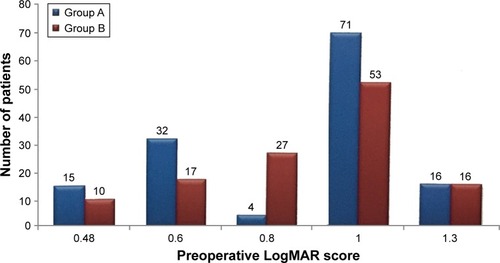
Figure 2 Postoperative LogMAR score of both groups. Group A, temporal approach; Group B - supereior approach.
Abbreviations: BCVA, best-corrected visual acuity; LogMAR, logarithm of the minimum angle of resolution; UCVA, uncorrected visual acuity.
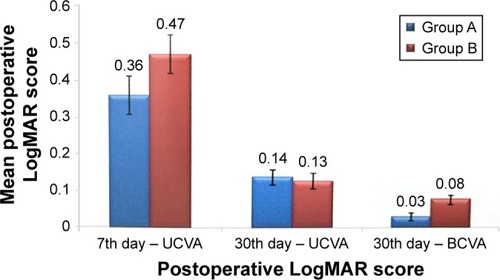
Table 1 Distribution of patients according to astigmatism and study groups
Table 2 Distribution of astigmatism in patients according to type and study groups
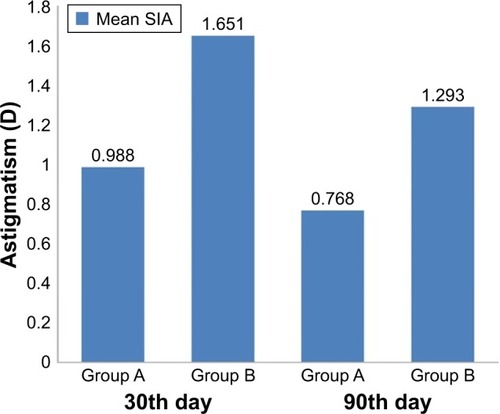
Figure 3 SIA in group A and group B on 30th and 90th day. Group A, temporal approach; Group B, superior approach.
Abbreviation: SIA, surgically induced astigmatism.