Figures & data
Figure 1 Experimental setup.
Abbreviations: BS, beam splitter; LS, line of sight; MA, meas urement axis; S, screen; VTs, visual targets.
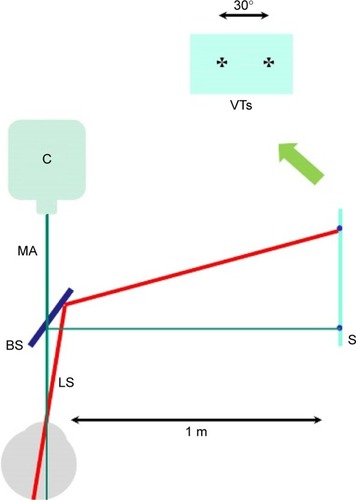
Table 1 Study participant’s group profiles
Table 2 Summary of refraction profiles along four meridians
Figure 2 Changes of refractive components as functions of horizontal visual field angle.
Abbreviations: Em., emmetropic; HM, high myopic; LM, low myopic; MM, moderate myopic; SEM, standard error of the mean.
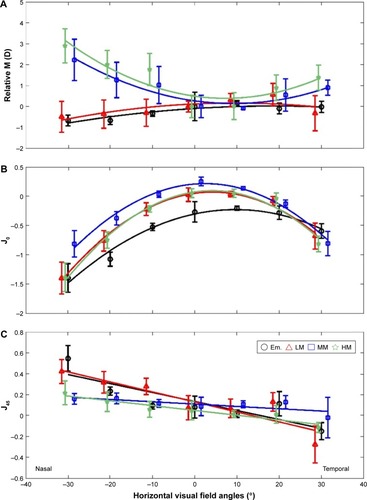
Figure 3 Changes of refractive components as functions of 45° diagonal visual field eccentricities.
Abbreviations: Em., emmetropic; HM, high myopic; LM, low myopic; MM, moderate myopic; SEM, standard error of the mean.
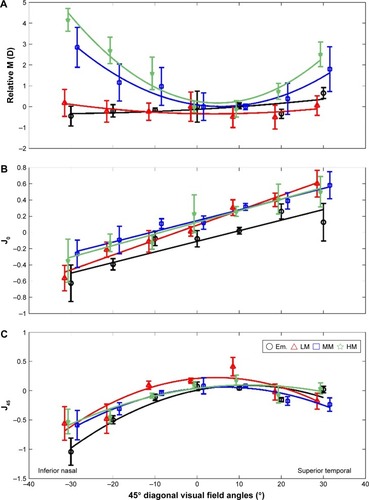
Figure 4 Changes of refractive components as functions of vertical visual field eccentricities.
Abbreviations: Em., emmetropic; HM, high myopic; LM, low myopic; MM, moderate myopic; SEM, standard error of the mean.
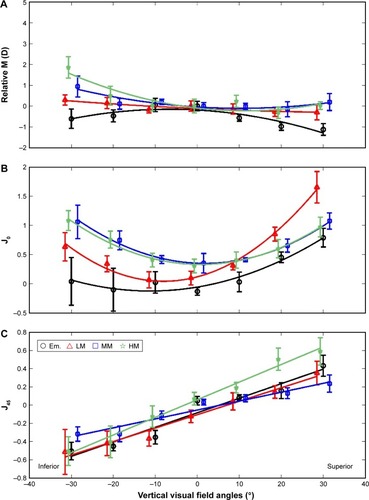
Figure 5 Changes of refractive components as functions of 135° diagonal visual field eccentricities.
Abbreviations: Em., emmetropic; HM, high myopic; LM, low myopic; MM, moderate myopic; SEM, standard error of the mean.
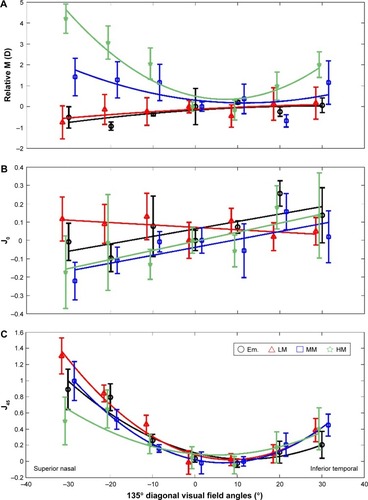
Figure 6 Relative SCRIB data (peripheral SCRIB – central SCRIB) fitted across 60° visual field using a triangle-based cubic interpolation method in (A) emmetropia, (B) low myopia, (C) moderate myopia and (D) high myopia.
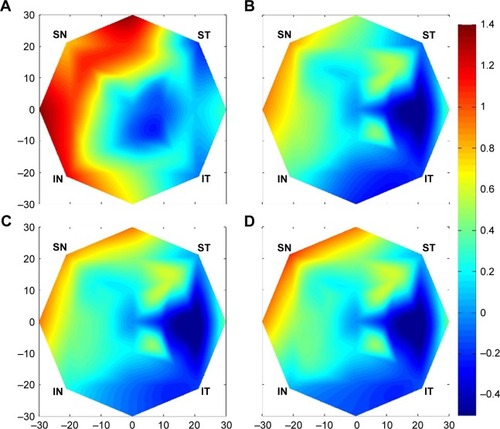
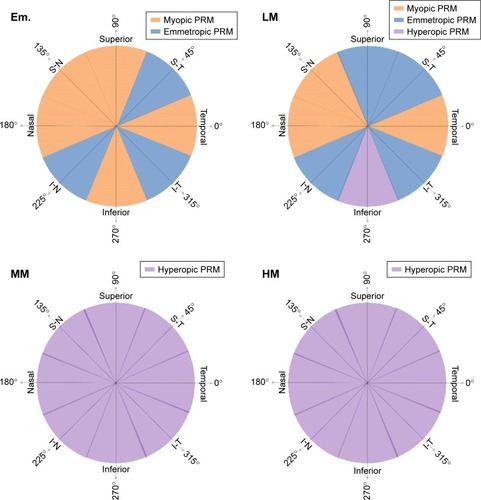
Figure 7 PRM patterns in different subject groups.
Abbreviations: Em., emmetropic; HM, high myopic; LM, low myopic; MM, moderate myopic; PRM, peripheral relative M.